Book

Gibson RS1  Principles of
Nutritional Assessment:
Body Composition

3rd Edition, July 2024


Abstract

Most anthropometric methods used to assess body compo­sition are based on the two com­ponment model whereby the body consists of fat and fat-free mass. These two body com­ponents can be assessed indirectly from selected skin­fold thick­ness and cir­cum­fer­ence measure­ments taken by stan­dard­ized tech­niques. Several methods exist for estim­ating per­cent­age body fat and/or total body fat. In the simplest method, skin­fold thick­ness measure­ments, either singly or in combination, are used to assess body fat (as % or total). Alternatively, per­cent­age body fat can be predicted from adiposity equations matched to the meas­ured skin­folds and study population (by age, gender, ethnicity, activity level, etc). Arm-fat area, calculated from triceps skin­fold thick­ness and mid-upper arm cir­cum­fer­ence (MUAC), is also used as a proxy for total body fat, although the equation used has some limitations. Both WHO international and population-specific refer­ence data are avail­able for triceps and subscap­ular skin­folds for children. Arm-fat area data are more limited, although data for U.S. children (1-20y) from the CDC2000 BMI growth chart sample have been compiled.

Anthropometric variables from multiple anatomical sites are also used to estimate body density, from which the per­cent­age of body fat, and subsequently, total body fat is calculated. The reliability of this method has been questioned based on comparisons of the derived per­cent­age body fat esti­mates against those generated using the in vivo gold standard 4-com­ponent model which does not rely on any theoret­ical assumptions. Corrections that account for age, sex, disease state or nutritional status can now be applied to the density-based formulae and/or the empirical equations used to relate fat content to body density, and thus improve the final assessment of body compo­sition.

Recognition of the link between the distri­bution of body fat and risk of cardiovascular disease has prompted use of waist-hip ratio (WHR), and more recently, waist cir­cum­fer­ence (WC), as practical anthropometric surrogates for intra-abdominal visceral fat. Population-specific cutoffs for adults have been set to denote high WHR or WC indicative of abdominal obesity and cardiovascular risk. Increasingly, WC is being included along with BMI in all obesity surveillance studies.

Fat-free mass can be estim­ated as body weight (kg) minus body fat from the adiposity or density-based methods outlined above. Alternatively, simpler methods include the measure­ment of MUAC, either alone or combined with triceps skin­fold thick­ness to calculate arm mid-upper-muscle cir­cum­fer­ence (MUAMC) or arm muscle area (AMA). MUAC alone is used in emergencies to screen for severe acute malnutrition (SAM), whereas MUAMC and AMA can be used as proxies for muscle mass, and thus for the detection of sarco­penia in the elderly. AMA is preferable to MUAMC because it more adequately reflects the true magnitude of tissue changes.

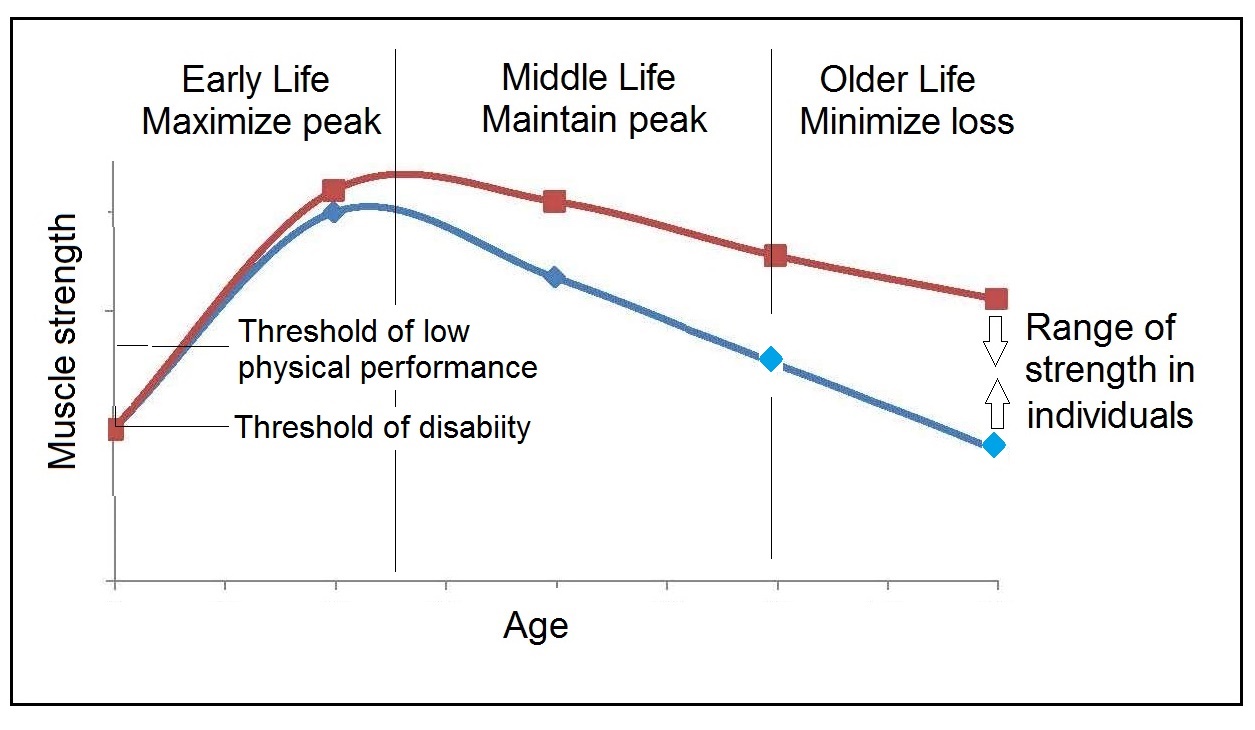
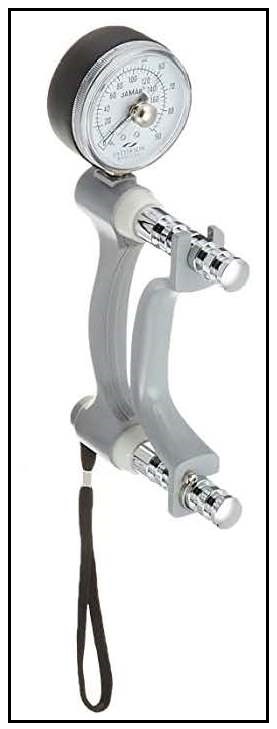
Calf cir­cum­fer­ence and hand grip strength as surrogate markers of skel­etal muscle mass and strength respectively, are increasingly being used, in part because loss of both muscle mass and strength has been associ­ated with several adverse health outcomes. Both measure­ments are recommended by the Asian and European Working Groups on Sarcopenia to identify at risk older adults. The measure­ments are also used in children and athletes to assess physical fitness. Adiposity has been identified as a confounder of calf cir­cum­fer­ence measure­ments, and BMI adjust­ment factors have been developed. Low calf cir­cum­fer­ence with any BMI can now be identified. Population-specific calf cir­cum­fer­ence cutoff values are avail­able to detect low muscle mass in adults. Handgrip strength is said to be a better predictor of functional health outcomes than low muscle mass, and has been linked with alteration in physical performance in cross-sectional studies. Associations with all-cause mortal­ity, cardiovascular mortal­ity, and hospital readmissions have also been observed in prospective cohort studies. Hand grip strength is meas­ured with a calibrated handheld dynamometer. The measure­ments depend on the model used, but dynamometer-specific cutoffs values are not yet applied. Current cutoffs for weak muscle strength vary across regions; population specific normative refer­ence data are avail­able for the elderly and across the life course.

Finally, the cross-sectional nature of the normative refer­ence data compiled for the anthropometric variables discussed limits their use for monitoring the trajectories of individuals and the degree to which causal and age-related inferences can be drawn. None of the anthropometric variables are sensitive enough to monitor small changes in body fat or fat-free mass that may arise after short-term nutritional support or deprivation.

CITE AS: Gibson RS. Principles of Nutritional Assessment: Body Composition. https://nutritionalassessment.org/bodycomposition/
Email: Rosalind.Gibson@Otago.AC.NZ
Licensed under CC-BY-4.0
( PDF ).
11.0 Anthropometric assessment of body compo­sition

Most anthropometric methods used to assess body compo­sition are based on a model in which the body consists of two chemically distinct com­ponents: fat and the fat-free mass, with the principle that if one of these compo­nents is deter­mined, the other can be estim­ated. The amount and distri­bution of both body fat and the fat-free mass have important health outcomes in infants, children, and adults.

Fat is the main long-term storage form of energy in the body, and alterations in body fat content provide indirect esti­mates of changes in energy balance. Most of the body fat is stored in adipose tissue, which is distrib­uted in dif­ferent pro­port­ions through­out the body. The pattern of distri­bution of adipose tissue is dependent on many factors including sex, age, race/eth­nicity, geno­type, diet, physical activity, and hormone levels. Adipose tissue is tradition­ally distrib­uted into two main compo­nents, each with dif­fer­ent meta­bolic charact­er­istics: sub­cut­aneous adipose tissue (SAT) and visceral adipose tissue (VAT). Of the two compo­nents, visceral adipose tissue is a hormon­ally active compo­nent of total body fat tissue and an inde­pen­dent risk marker of cardio­vascular and meta­bolic morbid­ity and mortal­ity. Abnorm­ally high deposition of VAT is known as visceral obesity (Neeland et al., 2019).

Fat may also be present in areas of the body where fat is not physio­logic­ally stored, such as liver, pancreas, heart, and skel­etal muscle. Fat sur­rounding these organs is termed ectopic fat, and its depos­ition might contribute to increased risk of athero­scler­osis and type 2 diabetes (Neeland et al., 2019). The mechanisms whereby an excess of VAT is related to various health outcomes, as well as the ten­dency to deposit adipose tissue in ectopic depots are not fully understood; see Neeland et al., 2019 for more details.

The fat-free mass consists of the skel­etal muscle, non-skel­etal muscle, organs, connective tissue, total body water, and the skel­eton. Muscle is a major compo­nent of the fat-free mass and the primary site for glucose uptake and storage, as well as a reservoir of amino acids stored as protein. Loss of muscle mass is associ­ated with several negative health outcomes, including delayed recovery from illness, slowed wound healing, reduced meta­bolic rate, and physical dis­ability (Argilés et al., 2016).

Patients at high risk of losing muscle are those who are exper­iencing weight loss through diseases or conditions associ­ated with inflam­matory compo­nents, and malnutrition (Cruz-Jentoft et al., 2019). Risk of death during infect­ions is exacer­bated by the loss of muscle mass in mal­nour­ished children (Briend et al., 2015). Aging may also lead to a loss of muscle mass. This condition is known as sarco­penia, and results in diminished quality of life, greater suscept­ibility to infection, and an increased risk of mortal­ity (Deutz et al., 2019).

The anthropometric measure­ments of body compo­sition are fast, non­invasive, and require the minimum of equip­ment com­pared to labor­atory tech­niques. Consequently, anthro­pometry has been the method most frequ­ently used in the past in both routine clinical and public health settings. Increas­ingly, however, recognition of the limit­ations of anthro­pometry to assess body compo­sition has led to the use of alter­native laboratory methods to assess body compo­sition such as bio­elec­trical imped­ance analysis (BIA) and dual energy X-ray absorp­tiometry (DXA) in these settings (Howell et al., 2018; Schubert et al., 2019). See Chapter 14 for details of these laboratory methods.

In clinical practice, indices of body compo­sition can be used to identify patients with chronic under‑ or over­nutrition and to monitor long-term changes in body compo­sition during nutrit­ional support. In public health, they can identify individ­uals who are vulner­able to under‑ or over­nutrition and help evaluate the effective­ness of nutrition inter­vention programs.

Details of the stan­dard­ized procedures used for anthro­pometric measure­ments of body compo­sition, and the deriv­ation of the more impor­tant indices and their limit­ations are sum­marized in this chapter and are given in detail in Lohman et al. (1988). Variability in body compo­sition across popul­ations associ­ated with life­style, environ­ment, genetics, and ethnicity has empha­sized the need for pop­ulation-specific refer­ence data to interpret body compo­sition indices (Wells, 2019). Hence, where appro­priate, the inter­pretive criteria avail­able for the assessment of body compo­sition based on anthro­pometry, are also summarized. For a review of the methods used to develop refer­ence values and cutoff points, the reader is advised to consult Chapter 1.

11.1 Assessment of body fat

The body fat content is the most variable compo­nent of the body, differing among indiv­iduals of the same sex, height, and weight. Estimates of total body fat, together with the rate of change in the body fat content, are often used to assess the presence and severity of under­nutrition. A large and rapid loss of body fat is indic­ative of severe negative energy balance. Small changes in body fat (i.e., < 0.5kg), however, cannot be meas­ured accurately using anthro­pometry.

On average, the fat content of women is higher than that of men, represent­ing 26.9% of their total body weight com­pared with 14.7% for men (Table 11.1).
Table 11.1 Distribution of body fat in refer­ence man and women. Data in kilograms. Weights for total fat and body weight in refer­ence man and woman from Behnke (1969). Other weights from Allen et al. (1956), Alexander (1964), and Wilmore and Brown (1974).
Fat location man woman
Essential fat (lipids of
the bone marrow, central
nervous systems, mammary
glands and other organs)
2.14.9
Storage fat (depot)8.2 10.4
Subcutaneous                 3.1                5.1
Intermuscular                 3.3                 3.5
Intramuscular                 0.8                 0.6
Fat of thoracic and
abdominal cavity
                1.0                 1.2
Total fat10.5 15.3
Body weight 70.0 56.8
Percentage fat 14.7 26.9
Body fat is deposited in two major types of sites: one for essential lipids, and the other for storage of fat. Essential lipids are found in the bone marrow, central nervous system, mammary glands, and other organs and are required for normal physio­logical function­ing; fat from these sites makes up about 9% (4.9kg) of body weight in refer­ence woman and 3% (2.1kg) in refer­ence man. Storage fat consists of inter‑ and intra-muscular fat, fat surroun­ding the organs (e.g., liver, heart, pancreas) and gastro­intes­tinal tract, and sub­cut­aneous fat (Lohman, 1981). The pro­por­tion of storage fat in males and females is relatively constant, averaging 12% of total body weight in males and 15% in females.

Of the total body fat, over one-third in refer­ence man and woman is estim­ated to be sub­cut­aneous fat. Body fat is expressed either in absol­ute terms (the weight of total body fat in kilograms) or as a percen­tage of the total body weight. There is, how­ever, a lack of con­sensus about the useful­ness of percen­tage body fat as an index of adi­posity. Some inves­tiga­tors argue that percen­tage body fat over-adjusts for weight because it includes the fat mass compo­nent in both the numer­ator and denom­in­ator (Cole et al., 2008). A further limit­ation is that percen­tage fat is not fully inde­pen­dent of body size. High percen­tage fat values might reflect high adiposity or low lean mass (Wells, 2014).

In population studies, body fat is often assessed by anthro­pometry. In the past, body mass index has been the prin­cipal index used to pre­dict excess adiposity; see Chapter 10 for more details. How­ever, skin­fold thick­ness determin­ations, either alone or in assoc­iation with other anthro­pometric variables (e.g., limb girths and breadths), are also used to pre­dict percen­tage body fat; over six hundred pre­dic­tion equations have been devel­oped. Assoc­iations between these anthro­pometric variables and percent body fat differ by many factors including gender, age, race / ethnicity, and level of adi­posity so that pre­dic­tion equations must be care­fully matched with the popul­ation under study and stan­dard­ized tech­niques used for the measure­ments (Provyn et al., 2011).
Figure 11.1
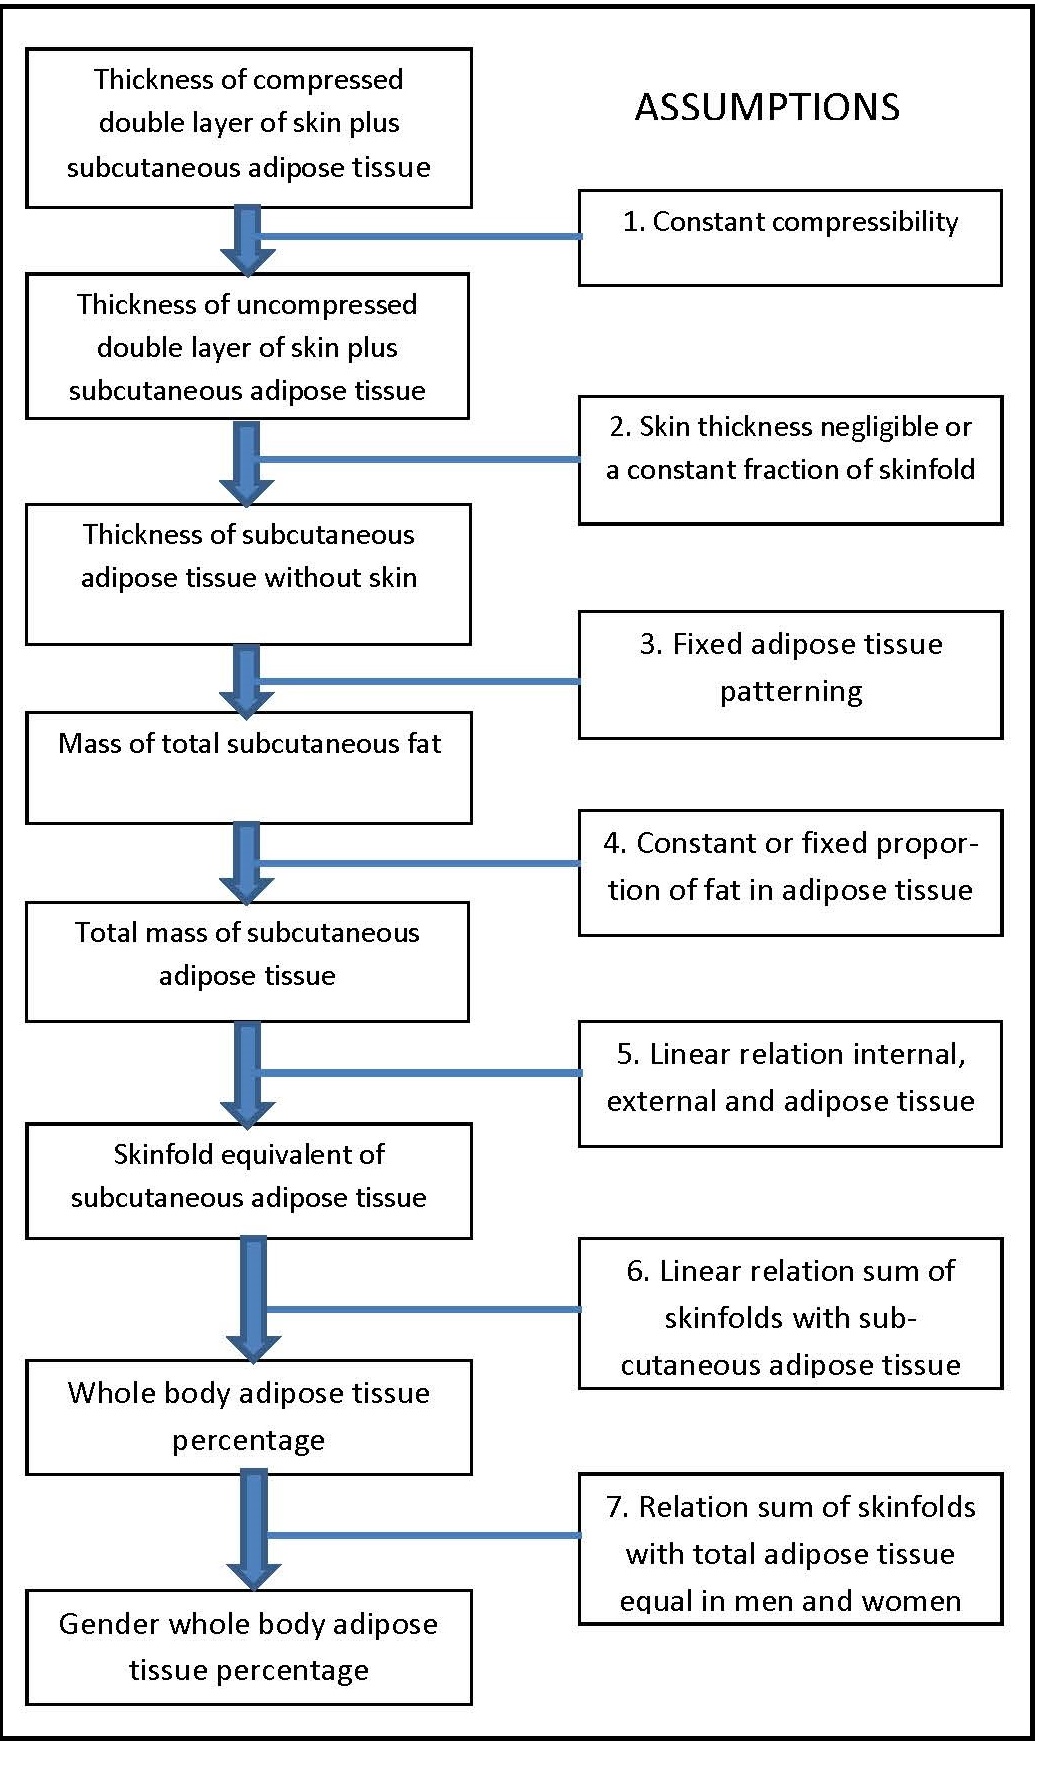
Figure 11.1. Flow chart of the transformation from skin­fold to total body adiposity; eight possible steps (left) and possible assumptions (right). Modified from: Provyn et al. (2011)

More recently, the impor­tance of the distrib­ution of body fat has been empha­sized. Numerous studies have reported correl­ations between the amount of intra-abdominal fat (i.e., visceral adipose tissue) and meta­bolic disturb­ances linked to the risk of cardio­vascular disease (Neeland et al., 2019; Ross et al., 2020). These findings have led to the assess­ment of visceral adipose tissue as an inde­pen­dent risk marker of cardio­vascular and meta­bolic morbid­ity and mortal­ity (Hiuge-Shimizu et al., 2012). Waist-hip cir­cum­fer­ence ratio and, increasingly, waist cir­cum­fer­ence alone, are being used as anthro­pometric surro­gates for intra-abdom­inal visceral fat (Sections 11.1.6 and 11.1.7).

11.1.1 Skin­fold thick­ness measure­ments

Skin­fold thick­ness measure­ments provide an estimate of the size of the sub­cut­aneous fat depot, which, in turn, has been used to derive an estimate of total body adiposity. Such an estimate is based on seven assump­tions shown in Figure 11.1, most of which are not true. For example, the relation­ship between sub­cut­aneous and internal fat is non­linear and varies with body weight and age: very lean subjects have a smaller pro­por­tion of body fat deposited sub­cut­aneously than obese subjects. More­over, varia­tions in the distrib­ution of sub­cut­aneous fat occur with sex, race or ethnicity, and age (Wagner & Heyward, 2000). For a detailed discussion of the limit­ations of each of the seven assump­tions depicted in Figure 11.1, see Provyn et al. (2011).

Figure 11.2
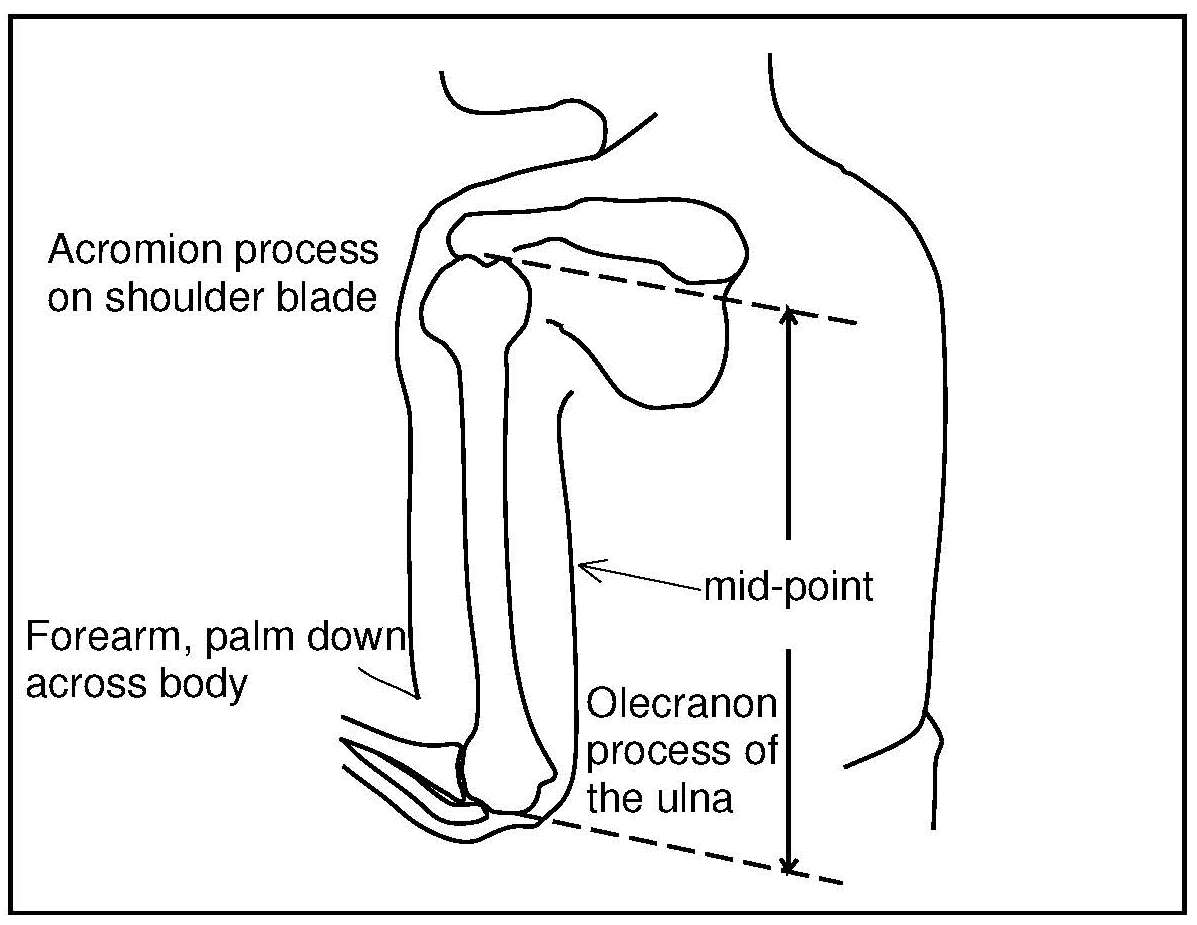
Figure 11.2. Location of the midpoint of the upper arm. Redrawn from Robbins et al. (1984).

The follow­ing skin­fold sites, described in detail in Lohman et al. (1988), are commonly used:

Figure 11.3
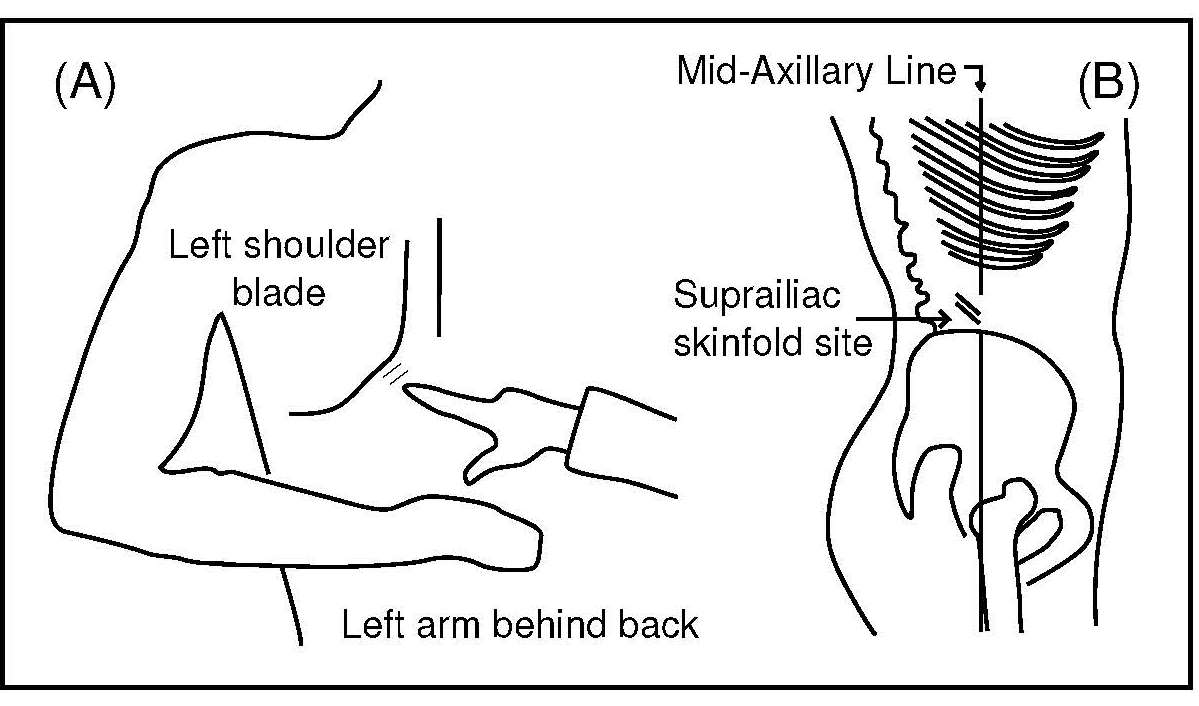
Figure 11.3. Location of the subscap­ular (A) and suprailiac (B) skin­fold sites.

Marked ethnic differences in adiposity based on skin­folds (as well as fat mass via BIA and DXA) have been reported. For example, greater sub­cut­aneous fat­ness was reported for white boys com­pared to their black counter­parts in the U.S. (Addo & Himes, 2010). These data were based on the population of healthy U.S. children aged 1‑20y used to construct the CDC 2000 BMI charts (Kuczmarski et al., 2000a). For these BMI charts, the weight data for children > 6y who participated in the NHANES III survey were excluded because the inclusion of these data shifted the upper percentile curves.

Race-ethnicity differences in skin­folds have also been reported in children living in the U.K.   Adi­posity levels were higher among South Asian children based on the sum of four skin­folds (biceps, triceps, subscap­ular and suprailiac), whereas black African Caribbean children had similar or lower adi­posity levels than white Euro­peans (Nightingale et al., 2011). Clearly, race-ethnicity differ­ences in fat pat­tern­ing should be taken into account when inter­preting results based on sub­cut­aneous skin­folds.

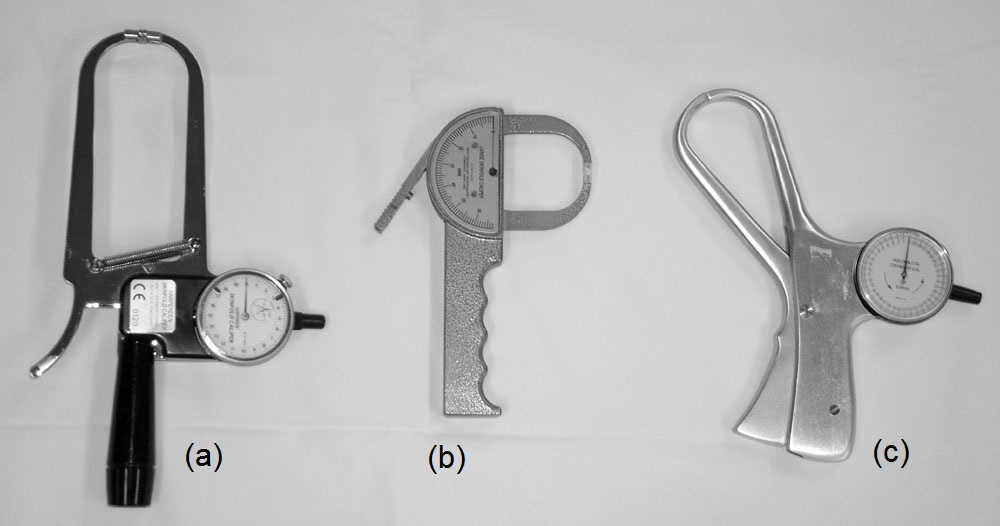
Skin­fold thick­ness measure­ments are best made using precision thick­ness calipers; they measure the compressed double fold of fat plus skin. As a result of the com­pres­sion, they always under­estimate actual sub­cut­aneous fat thick­ness. The skin­fold is always grasped at the marked site with the fingers on top, thumb below, and fore­finger on the marked site. Three types of precision calipers can be used: Harpenden, Lange, and Holtain (Figure 11.4).

Figure 11.4
Figure 11.4. Harpenden (a), Lange (b), and Holtain (c) precision skin­fold thick­ness calipers.

Precision calipers are designed to exert a defined and constant pressure throughout the range of meas­ured skin­folds and to have a standard contact surface area or “pinch” area of 20‑40mm2. The skin­fold calipers must be recalib­rated at regular intervals using a calibra­tion block. Both the Harpenden and Holtain skin­fold calipers, which have a standard jaw pressure of 10g/mm2, give smaller skin­fold values than Lange calipers, which are fitted with a lighter spring (Gruber et al., 1990). For example, values from Holtain calipers are about 2‑5mm (mean) lower than those obtained using the Lange calipers (Lohman et al., 1984). Hence, care must be taken to ensure the same precision calipers are used when examining secular trends in skin­fold thick­nesses.

For all the skin­fold measure­ments, the subject should stand erect with the weight evenly distributed and feet together, shoulders relaxed, and arms hanging freely at the sides. The measure­ment tech­nique is described in detail for the triceps skin­fold, as the latter is the site most frequently used to obtain a single indirect measure of body fat; the tech­nique used for the other skin­fold sites is similar. There is no con­sen­sus as to whether the left or right side of the body should be used. In the WHO Multicentre Child Growth Reference Study, triceps and subscap­ular measure­ments were taken on the left side of the body (de Onis et al., 2004). A description of these measure­ment protocols are avail­able in the WHO anthropometric training video. How­ever, the current practice of the U.S. National Health and Nutrition Examination Surveys (NHANES) is that skin­fold sites are meas­ured on the right side of the body.

Measurement of triceps skin­fold

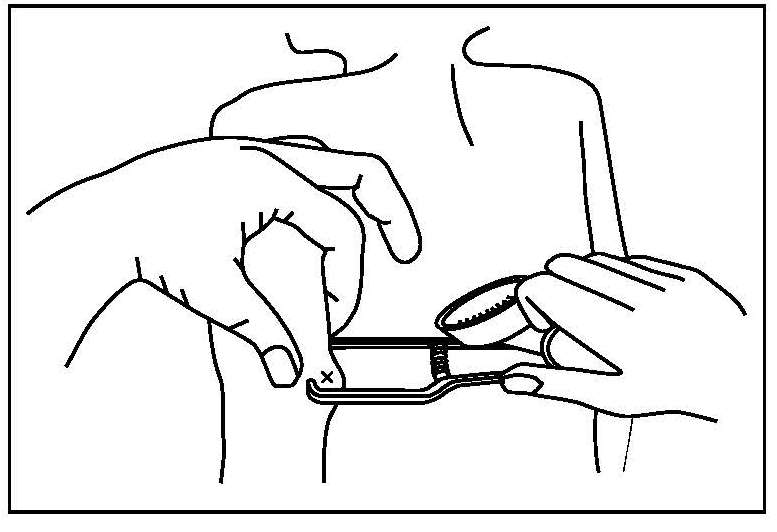
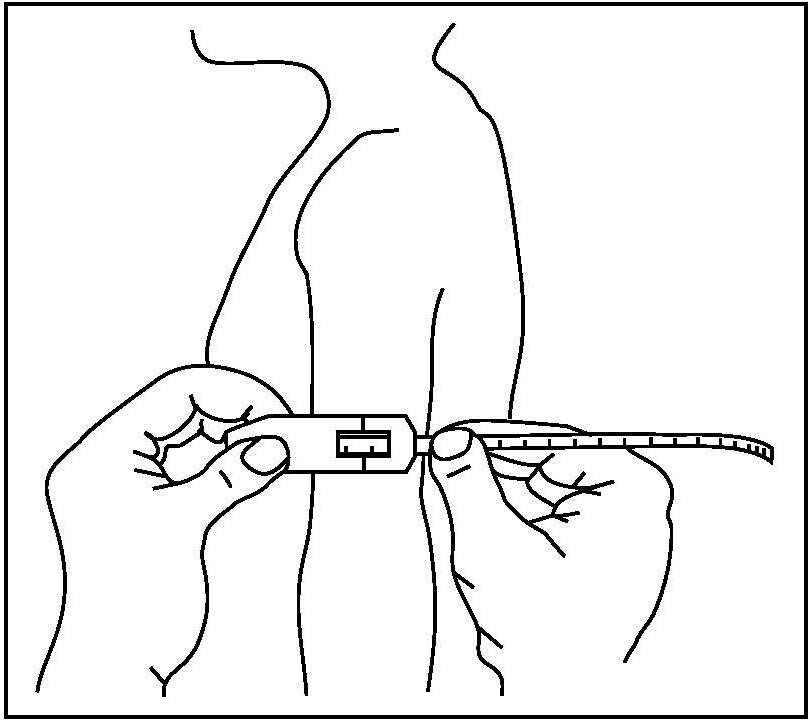
The measure­ment of the triceps skin­fold is performed at the midpoint of the upper right arm, between the acromion process and the tip of the olecranon, with the arm hanging relaxed. To mark the midpoint, the right arm is bent 90° at the elbow, and the forearm is placed palm down across the body. Then the tip of the acromion process of the shoulder blade at the outermost edge of the shoulder and the tip of the olecranon process of the ulna are located and marked. The distance between these two points is meas­ured using a non-stretchable tape, and the midpoint is marked with a soft pen or indelible pencil, directly in line with the point of the elbow and acromion process (Figure 11.2). The right arm is then extended so that it is hanging loosely by the side. The examiner grasps a vertical fold of skin plus the underlying fat, 2cm above the marked midpoint, in line with the tip of the olecranon process, using both the thumb and forefinger. The skin­fold is gently pulled away from the underlying muscle tissue, and then the caliper jaws are applied at right angles, exactly at the marked midpoint (Figure 11.5). The skin­fold remains held between the fingers while the measure­ment is taken.

Figure 11.5
Figure 11.5 Measurement of the triceps skin­fold in the upright position using the Harpenden caliper. Redrawn from: Robbins et al. (1984).

When using the Lange, Harpenden, or Holtain calipers, pressure must be applied to open the jaws before the instrument is placed on the skin­fold; the jaws will then close under spring pressure. As the jaws compress the tissue, the caliper reading generally diminishes for 2‑3s, and then the measure­ments are taken. Skin­folds should be recorded to 0.1mm on the Harpenden and Holtain skin­fold calipers and to 0.5mm on the Lange.

Triceps skin­fold measure­ments can also be made with the subject lying down. The subject lies on the left side with legs bent, the head supported by a pillow, and the left hand tucked under the pillow. The right arm rests along the trunk, with the palm down. The measure­ment is taken at the marked midpoint of the back of the upper right arm, as described above. The examiner should be careful to avoid parallax errors by bending down to read the calipers while taking the measure­ments (Chumlea et al.,1984).

Precision of skin­fold measure­ments

Within-examiner and between-examiner measure­ment errors can occur when mea­sur­ing skin­folds, particularly for subjects with flabby, easily compres­sible tissue or with very firm tissue that is not easily deformed (Lukaski, 1987). Errors may also occur when mea­sur­ing skin­folds in obese subjects (Forbes et al., 1988).

Within-examiner errors can occur when the same examiner fails to obtain identical results on repeated skin­folds on the same subject; such errors are a function of the skin­fold site, the experience of the examiner, and the fatness of the subject. Within-examiner measure­ment errors can be small when mea­sur­ing triceps skin­folds, provided that training in stan­dard­ized procedures is given; the errors in these circumstances typically range from 0.70‑0.95mm (Table 11.2).
Table 11.2 Reported values for within-observer and between-observer tech­nical error of the measure­ment (TEM) for skin­fold measure­ments. Data from Ulijaszek & Kerr (1999).
Skin­fold
measure­ment
no. of
studies
Mean
(mm)
Range
(mm)
Within-observer TEM
     Biceps 3 0.17 0.1–0.2
     Triceps 21 0.84 0.1–3.7
     Subscapular 19 1.26 0.1–7.4
     Suprailiac 10 1.16 0.1–3.2
Between-observer TEM
     Biceps 8 0.84 0.2–2.1
     Triceps 28 1.06 0.2–4.7
     Subscapular 28 1.21 0.1–3.3
     Suprailiac 11 2.28 0.3–6.4
Between-examiner errors arise when two or more examiners measure the same subject and skin­fold site; such errors are usually larger than within-examiner errors, but they can be reduced to not more than 2mm with training and care (Burkinshaw et al., 1973). Within‑ and between-examiner measure­ment errors tend to be greater if very large (> 15mm) or small (< 5mm) skin­folds are meas­ured (Edwards et al., 1955).

Table 11.2 lists some reported values for both within- and between-examiner tech­nical error of the measure­ment (TEM) (Chapter 9) for biceps, triceps, subscap­ular, and suprailiac skin­fold measure­ments, compiled by Ulijaszek and Kerr (1999). Consult Chapter 9 on how to measure TEM.

Within‑ and between examiner TEMs for triceps and sub­scap­ular skin­folds were also calcu­lated in the WHO Multi­centre Growth Refer­ence Study (MGRS) (de Onis et al., 2004); the values are shown in (Table 11.3). As expected, the range for the between-examiner TEM for both the long­itud­inal and cross-sect­ional compo­nents of the MGRS from the six country sites was larger than the range for the within-examiner TEM for these two skin­folds. For more details, see WHO (2006).

Zerfas (1985) has evaluated the measure­ment error for skin­folds from any site using a repeat-measures protocol and recom­mended target values for the differ­ences between the trainee and a criterion
Table 11.3 Reported values in mm for the within-examiner and between-examiner tech­nical error of the measure­ment (TEM) for the routine MGRS data. Long­itudinal measure­ments were made by the follow-up team during the long­itudinal compo­nent. Cross-sect­ional data are from the MGRS cross-sect­ional compo­nent.
Skin­fold
measure­ment
Range
(mm)
Within-examiner TEMMGRS teams
     Triceps 0.39-0.61
     Subscapular 0.29-0.41
Between-examiner TEM
     Triceps
          Longitudinal 0.50-0.83
          Cross-sectional 0.46-0.85
     Subscapular
          Longitudinal 0.42-0.69
          Cross-sectional 0.44-0.62
anthro­pometrist; the target training values are shown in (Table 11.4). A difference of more than 5mm between the measure­ments of the criterion anthro­pometrist and the trainee indicates a gross error related to the reading or recording; a difference between the measure­ment of the criterion anthro­pometrist and the trainee of 0.0‑0.9mm indicates that the trainee has reached an acceptable level of pro­ficiency in the measure­ment tech­nique.

In the WHO Multi­centre Growth Reference Study, measure­ments for triceps and subscap­ular skin­folds were taken on each child by two trained and stan­dard­ized anthro­pom­etrists. Their values were then com­pared to ensure that the duplicate measure­ments were within the maximum allowable differ­ence, designated as 2.0mm for each skin­fold (de Onis et al., 2004).

Sports anthro­pom­etrists have set target values for train­ing which also include skin­folds and arm cir­cum­fer­ence measure­ments (Gore et al., 1996); these could be adopted by nutrition­ists. Suggested target values are expressed as TEM (as a per­cent­age), and for skin­folds are 7.5 (level 1) and 5.0 (levels 2 and 3). Criterion anthro­pom­etrists should be expected to achieve a %TEM of 5.0 for skin­folds.

Table 11.4 Evaluation of measure­ment error in anthropometric measure­ments. After Zerfas (1985). Differences greater than those noted under “Poor” are taken to indicate a gross error. Data from Ulijaszek & Kerr (1999).
Trainee-trainer difference
Measurement Good Fair Poor
Height or length (mm) 0–5 6–9 10–19
Weight (kg) 0–0.1 0.2 0.3–0.4
Arm circ. (mm) 0–5 6–9 10–19
skin­folds (any) (mm) 0–0.9 1.0–1.9 2.0–4.9

Secular trends in adiposity across populations have been examined by mea­sur­ing triceps and subscap­ular skin­fold thick­nesses. How­ever, in a sample of > 45,000 U.S. adults participating in the NHANES surveys con­ducted from 1988‑1994 through 2009‑2010, Freedman et al. (2017) concluded that it is unlikely that skin­fold thick­nesses could be used to monitor trends in obesity. The changes in the meas­ured skin­fold thick­nesses were small and fell within the tech­nical error of the respective skin­fold measure­ments.

Interpretive criteria for triceps and sub-scapular skin­folds

The WHO included triceps and subscap­ular skin­fold thick­ness measure­ments in the con­struct­ion of the Multi­center Child Growth Standard (MCGS) for young children aged 0‑5y. Children from six diverse countries (Brazil, China, India, Norway, Oman, and the USA) were included. To reduce the impact of environ­mental variation, only privileged healthy popul­ations were selected (See Chapters 9 and 10 for more details). Charts based on sex-specific per­cent­iles and Z‑scores for triceps-for-age (WHO MCGS Triceps) and subscap­ular-for-age (WHO MCGS Subscapular) are avail­able for children 3mos‑5y. Details of the stan­dard­ized methods used and the devel­op­ment of these refer­ence data are avail­able (de Onis et al., 2004).

Age‑ and sex-stan­dard­ized percen­tile refer­ence curves for triceps and sub­scap­ular skin­fold thick­nesses have also been comp­iled for children of varying ages in several high-income countries (e.g., U.S., Spain, Poland) (Addo & Himes, 2010; Moreno et al., 2007; Jaworski et al., 2012). In the United States numerical data for the smoothed percentiles for triceps and subscap­ular skin­folds for U.S. girls and boys aged 1.50‑19.99y are avail­able in Addo and Himes (2010). These refer­ence data are based on the same population of children and adolescents used to construct the CDC 2000 growth curves for BMI-for-age (Kuczmarski et al., 2000a). Serrano et al. (2015) have cautioned the use of these U.S. skin­fold percentiles for interpreting skin­folds from Hispanic American children and adolescents because schoolchildren from Spain, Argentina, Cuba, Venezuela and Mexico were found to have higher triceps and subscap­ular percentiles than those of the CDC refer­ence (Addo & Himes, 2010; Kuczmarski et al., 2000a). Instead, Serrano et al. (2015) recommend using their triceps and subscap­ular skin­folds refer­ence values for Hispanic American children.

Increasingly, refer­ence data based on anthropometric measures of adiposity based on skin­folds are becoming avail­able from low and middle-income countries. Khadilkar et al. (2015) have published refer­ence percentiles for triceps skin­fold thick­ness for Indian children aged 5‑17y, whereas Pandey et al. (2008) provide percentiles for both triceps and subscap­ular skin­folds for urban Asian Indians aged 14‑18y. Again, these percentiles differed and were higher than those recorded for U.S. children. Even infants in South Asia appear to have subscap­ular skin­folds at birth that are higher than those for comparable birth­weight Caucasian babies, despite having other body measure­ments that are smaller (Yajnik et al., 2003).

Age‑ and sex-stan­dard­ized percen­tile refer­ence curves for triceps and subscap­ular skin­fold thick­nesses are especially useful in remote emergency settings, in bed-bound hospital­ized patients, and when other medical conditions are present that preclude the evaluation of weight, height, and body compo­sition (Heymsfield & Stevens, 2017).

11.1.2 Assessing body fat with skin­folds

Skin­fold measure­ments at a single or multiple sites can be used to estimate total body fat or per­cent­age body fat. Calcul­ation of per­cent­age body fat is based on the assump­tion that fat mass is adjusted for body weight, even though per­cent­age body fat is not fully inde­pen­dent of body size (Wells, 2014). Further­more, high values for per­cen­tage body fat might reflect either high fat mass or low fat-free mass, as noted earlier (Wells, 2019).

If a single skin­fold measure­ment approach is used, it is critical to select the skin­fold site that is most rep­resent­ative of the whole sub­cut­aneous fat layer, because sub­cut­aneous fat is not uniformly distrib­uted about the body. Unfor­tunately, the most rep­resent­ative site is not the same for both sexes, nor is it the same for all ages, ethnicities, or degree of adiposity. Hence, it is not sur­pris­ing that there is no general agree­ment as to the best single skin­fold site as an index of total body fat. In the past, the triceps skin­fold thick­ness has been the site most frequently selected by nutrit­ion­ists for a single, indirect estimate of body fat.

To account for the differing distrib­ution of sub&sny;cut­aneous fat, invest­igators often recom­mend taking one limb skin­fold (right triceps) and one body skin­fold measure­ment (right subscap­ular). For example, persons of African descent tend to have less sub­cut­aneous fat in the extremities than in the trunk relative to Caucasians, irre­spec­tive of age and athletic status (Wagner & Heyward, 2000).

More than 100 formulae have been developed to estimate per­cent­age body fat from skin­fold thick­ness measure­ments alone. The formulae have been established across varying populations, using numerous protocols with deviations in the skin­fold sites meas­ured (Lohman et al, 1988). Unfortun­ately, discrepancies have been reported when dif­fer­ent formulae are applied on the same set of individuals. This finding has led to the proposal that the sum of skin­fold sites (in mm) (prefer­ably using eight sites) may provide a more accurate and reliable outcome of body fat than using an indirect method based on anthro­pometric-based pre­dic­tion formulae (Kasper et al., 2021).

The measure­ment of multiple skin­folds and not just a single skin­fold to estimate body fat is partic­ularly advisable when individuals are undergoing rapid and pro­nounced weight gain. Changes in the energy balance are known to alter the rate of fat accumulation dif­fer­ently among skin­fold sites (Heymsfield et al., 1984)

11.1.3 Body adiposity index

The body adiposity index (BAI) is a surrogate measure of adiposity which is calculated as: \[ \small \mbox{BAI (%fat)} = \frac {\mbox{Hip cir­cum­fer­ence}}{\mbox{(Height)}^{1.5}} − \mbox{18}\] The body adiposity index (BAI) was developed by Bergman et al. (2011) in part as a result of the inability of BMI to distinguish between fat and fat-free mass. Several studies of adults have reported positive correlations of BAI with BMI and waist cir­cum­fer­ence (Nickerson et al., 2015). Further, BAI has been vali­dated as a measure of per­cent­age body fat against both DXA (Johnson et al., 2012; Sun et al., 2021; Nickerson et al., 2015), and more recently the 4‑com­ponent model (Fedewa et al., 2019). The 4‑com­ponent model is considered the gold standard criterion method for mea­sur­ing per­cen­tage body fat because the tech­nique reduces the need for theo­ret­ical assump­tions when calcul­ating body compo­sition outputs; information on body weight, body volume, total body water (TBW) and bone mineral mass are each collected separately (Wells, 2014). Never­the­less, results on the relative accuracy of BAI as a surrogate indic­ator of percen­tage body fat have been incon­sis­tent, and appear to be dependent on sex (Johnson et al., 2012; Fedewa et al., 2019), race-ethnicity (Johnson et al., 2012; Ramírez-Vélez et al., 2016), level of adiposity (Bergman et al., 2011; Johnson et al., 2012; Sun et al., 2021) and activity level (Esco, 2013). More research employing prospec­tive studies are needed to establish the pre­dic­tive ability of BAI for various health outcomes in differ­ing popul­ation groups.

11.1.4 Arm-fat area

The calculated cross-sectional area of arm fat, derived from skin­fold thick­ness and arm cir­cum­fer­ence meas­ure­ments, has been used as an index of total body fat, especially in emer­gency settings. Arm-fat area correlates more signif­icantly with total body fat (i.e., fat weight) than does a single skin­fold thick­ness at the same site. In contrast, the estimation of percen­tage of body fat from arm fat area is no better than the corres­ponding estimation from the skin­fold measure­ment, particularly in males (Himes et al., 1980).

The advantage of using arm-fat area to estimate body fat is expected; more fat is needed to cover a large arm with a given thick­ness of sub­cut­aneous fat than to cover a smaller arm with the same thick­ness of fat. Subcutaneous fat, however, is not evenly distributed around the limbs or trunk. For example, triceps skin­folds are consistently larger than the corres­ponding biceps skin­fold, and, as a result, either the sum or the average of these should theoretically be used for the calculation of mid-upper-arm-fat area (Himes et al., 1980). In practice, however, limb fat area refer­ence data are only avail­able based on triceps skin­fold and mid-upper-arm cir­cum­fer­ence (MUAC) measure­ments (Frisancho, 1990; Addo et al., 2017). Trained examiners using stan­dard­ized tech­niques should be used for these measure­ments; for details see Sections 11.1.1 and 11.2.1.

Calculation of arm-fat area

The equation for calculating mid-upper-arm-fat area is: \[ \small \mbox{AFA} = \mbox{(SKF } ×  \mbox{ MUAC/2)} − (π   ×  \mbox{ (SKF})^{2}/4)\] where AFA = mid-upper-arm-fat area (mm2), MUAC = mid-upper-arm cir­cum­fer­ence (mm), and SKF = triceps skin­fold thick­ness (mm). This equation is based on several assump­tions, each of which may result in inac­curacies, leading to an under­estimate of the degree of adiposity (Rolland-Cachera et al., 1997). The equation assumes that the limb is cylin­drical, with fat evenly distrib­uted about its cir­cum­fer­ence, and also makes no allow­ance for variable skin­fold com­press­ibility. This com­press­ibility prob­ably varies with age, sex, and site of the measure­ment, as well as among indi­vid­uals, and is a source of error in population studies when equal com­press­ibility of skin­folds is assumed.

Arm-fat areas calculated from this equation were reported to agree within 10% to values meas­ured by com­puterized axial tomography on normal weight adults. How­ever, for obese subjects, differences were greater than 50% (Heymsfield et al., 1982). A correction for skin­fold com­press­ibility may be advisable in future studies.

A simplified index has also been proposed, the upper-arm-fat estimate (UFE in cm2) \[ \small \mbox{UFE} = \mbox{MUAC } × \mbox{ TSF/2}\] This equation was vali­dated by comparing arm-fat areas assessed by magnetic resonance imaging (MRI) and anthropometry in 11 obese and 17 control children. Both the traditional upper-arm-fat area and the upper-arm-fat estimate (UFE) were calculated. Results indicated that the UFE meas­ure­ments were close to the MRI esti­mates (Rolland-Cachera et al., 1997). Never­the­less, this simplified index has had limited use.

Interpretive criteria

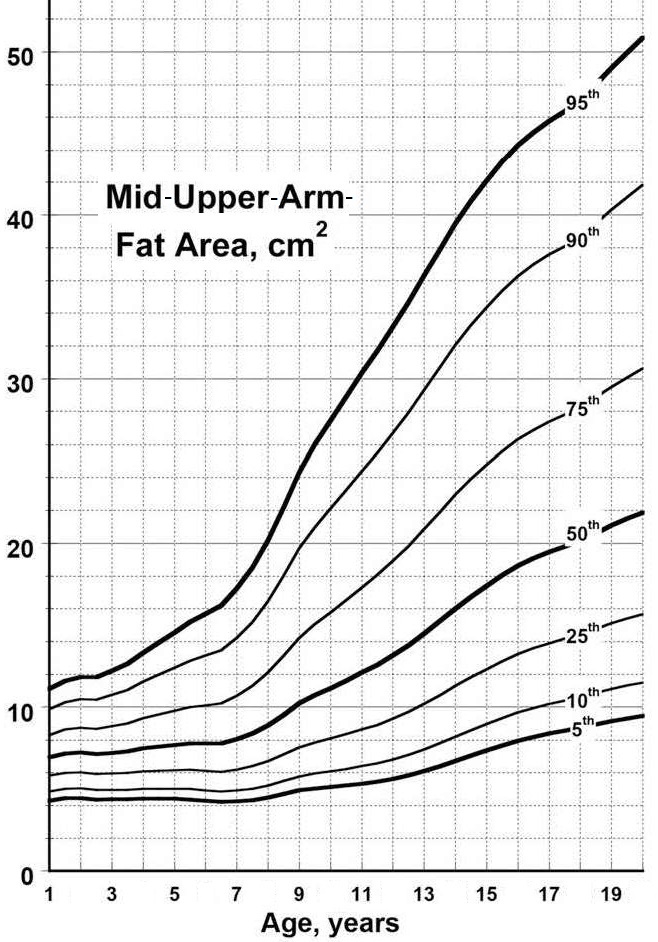
Reference data for mid-upper-arm-fat area were compiled by Frisancho (1981) from the earlier NHANES I survey (1971‑1974) when smoothing tech­niques were not applied. More recently, Addo et al. (2017) have derived sex-specific percentile curves for arm fat area based on a wider age range of U.S children (i.e., 1‑20y) who were also included in the devel­op­ment of the CDC 2000 BMI growth charts (Kuczmarski et al., 2000a). For these charts, the measure­ments for all children between 1963 and 1994 were included, with the exception of those > 6y of age who were meas­ured between 1988 and 1994. These children were excluded because of the rising prevalence of obesity (Kuczmarski et al., 2002). Figure 11.6 presents the arm-fat area percentiles for female US children and adolescents aged 1‑20y.
Figure 11.6
Figure 11.6 Upper-arm-fat-area-for-age percentiles for female US children and adolescents aged 1‑20y. Redrawn from Addo et al. (2017).

In addition to age and sex, height was also found to influence the ranking of mid-arm-fat area in this study. Hence, pre­dic­tion equations for height-for-age adjusted Z‑scores for arm-fat area-for-age are also reported for males and females; see Addo et al. (2017) for more details. How­ever, there is evidence that population-specific refer­ence data are needed for arm-fat area. Oyhenart et al. (2019a) com­pared the arm-fat area values of children aged 4‑14y in Argentina with the U.S. refer­ence data (Addo et al., 2017). The higher mean values of arm-fat area for 3rd, 50th, and 97th percentiles were indicative of greater adipose tissue for Argentinian boys and girls than for comparably aged U.S. children.

11.1.5 Calculation of body fat from anthropometric variables via body density

Measurements of anthropometric variables from multiple anatomical sites, including skinfolds, are also used to estimate body density from which the per­cent­age of body fat, and subsequently total body fat are calculated. The method involves:
  1. Determination of appro­priate skin­folds and other anthropometric measure­ments for the pre­dic­tion of body density; the selection of the sites depends on the age, sex, ethnicity/race, and population group under investigation
  2. Calculation of body density, using an appro­priate prediction equation
  3. Calculation of per­cent­age of body fat from body density using an empirical den­sito­metric equation
  4. Calculation of total body fat and/or the fat-free mass:
\[ \small \mbox{Total body fat (kg)} = \mbox{body weight (kg) × % body fat / 100}\] \[ \small \mbox{Fat-free mass (kg)} = \mbox{body weight (kg) − total body fat (kg)}\]

Choice of appro­priate anthropometric variables to estimate body density (Steps 1 and 2)

Many studies have invest­igated the best combin­ation of skin­folds and other anthro­pometric meas­ure­ments from which to derive a regres­sion equation for the initial estim­ation of body density (Steps 1‑2), prior to the calcul­ation of per­cent­age body fat (Step 3) by applying the empirical equations of Siri (1956) or Brožek (1963).

Numerous pre­dic­tion equations are avail­able to estimate body density from anthro­pometric vari­ables for popul­ation groups ranging from sedentary to athletic and from children to the elderly (Provyn et al., 2011). Rarely have the studies recom­mended the same combination of measure­ments. The selection of the most appro­priate pre­dic­tion equation should be based on the charact­er­istics of the population on which the chosen equation was originally vali­dated.

Several studies have examined the predictive accuracy and the applicab­ility of the pre­dic­tion form­ulae avail­able for estim­ating body density and sub­sequ­ently per­cent­age body fat. For example, Provyn et al. (2011) reported that even when the chosen pre­dictive form­ulae were matched to the charact­er­istics of the popul­ation (e.g., age, gender, ethnicity, activity level) on which the equation was originally valid­ated, the pre­dic­tion form­ulae invest­igated (n=57) were not neces­sarily reliable tools for pre­dicting per­cent­age body fat in Caucasian adults. This conclusion was based on the per­cent­age body fat esti­mates generated from dual-energy X‑ray absorp­tiometry (DXA), and con­firmed earlier from body fat data (in g) generated from direct dissection of domestic porcine hind legs (Provyn et al., 2008). Hence, the application of these pre­dic­tion formulae for estim­ating per­cent­age body fat on age-matched, apparently healthy indiv­iduals remains question­able.

Certainly, these pre­dic­tion formulae should not be used to pre­dict body density in under­nourished individuals, as there is a decreasing correl­ation between skin­fold thick­ness and total body fat content with increas­ing severity of under­nutrition. This change in correlation may arise from a shift of fat storage from the regions repres­ented by the subscap­ular and triceps skin­folds to other sub­cut­aneous sites. Alter­natively, a shift from sub­cut­aneous to deep visceral sites may occur (Spurr et al., 1981).

Calculation of per­cent­age body fat from body density using empirical equations (Step 3)

In most cases, the final stage in the calcul­ation of the per­cent­age of body fat (F) from measure­ments of skin­folds and other anthro­pometric variables is the selec­tion of an empir­ical den­sito­metric equa­tion relating fat content to body density (D). Several den­sito­metric equations have been derived based on the two‑com­ponent model for body compo­sition in which body weight is divided into fat and fat‑free mass, relying on assumptions that ignore inter-indiv­idual vari­ability in the compo­sition of fat-free mass. All the clas­sical den­sito­metric equa­tions assume: (a) the density of the fat‑free mass is relatively con­stant; (b) the density of fat for normal persons does not vary among indiv­iduals; (c) the water content of the fat-free mass is con­stant; and (d) the pro­por­tion of bone mineral (i.e., skel­eton) to muscle in the fat-free body is constant. All authors used the equation: \[ \small \mbox{%F} = \mbox{((C}_{1}/\mbox{D)} − \mbox{C}_{2}\mbox{) }×\mbox{ 100%} \] but dif­ferent authors used dif­ferent values for the density of fat and the fat-free mass and as a result the values for C1 and C2 differ slightly:

C1 = 4.950, C2 = 4.500 (Siri, 1961)
C1 = 4.570, C2 = 4.142 (Brožek et al. 1963)
C1 = 5.548, C2 = 5.044 (Rathburn & Pace, 1945)

All assume the density of fat and the fat-free mass are constant by age and sex. Siri (1961) assumed that the densities of fat and the fat-free mass are 0.90 and 1.10kg/L respectively. Brožek et al. (1963) and Rathburn & Pace (1945) used the concept of a refer­ence man of a specified density and com­pos­ition. These equations came from the chemical analysis of a few adult cadaver dis­sect­ions, animal data, and indirect esti­mates of fat-free mass in human subjects (Siri, 1961; Brožek et al., 1963; Heymsfield et al., 1991).

None of these classical empirical equations relating fat content to body density, however, are suit­able in adult patients in whom the com­pos­ition of fat-free mass may be abnormal. This will include patients under­going hyper­aliment­ation with high-sodium fluids, or with con­ges­tive heart failure or liver disease, as total body water content as a fraction of fat-free mass may be markedly higher in these patients, thus vio­lating the assumption that the water content of the fat-free mass is constant (Heymsfield & Casper, 1987). In these circumstances, the density of fat-free mass is decreased. Not surprisingly, in patients with diseases associ­ated with under-mineral­isation, the density of fat-free mass is also decreased. Consequently, in all these patients, fatness will be overestimated (Wells & Fewtrell, 2006).

More recent research has raised concerns over the assumption of constant proper­ties for hydration and density of fat-free mass when these classical empirical equations are applied to assess body com­pos­ition not only in patients with certain diseases, but also in healthy children and adol­escents, the elderly, and those with obesity. Although fat has relatively uniform proper­ties through­out the life course (zero water and a density of 0.9007kg/L), fat-free mass, in contrast, has dif­fer­ent proper­ties in children com­pared to adults. This arises because of chemical maturation of the fat-free mass during growth which results in higher levels of water and lower levels of mineral and proteins. Never­the­less, the adult-derived values for the density and hydration of fat-free mass and applied in the classical equa­tions have often been used to study body compo­sition in children.

In an effort to improve the accuracy in the esti­mates of percen­tage body fat in chil­dren and adoles­cents based on the two-com­ponent model, Wells et al. (1999) meas­ured the density and hydration of fat-free mass in children (n=41) aged 8‑12y using the 4‑com­ponent model which divides body weight into fat, mineral, and protein and over­comes the limit­ations assoc­iated with the assump­tions of constant proper­ties for hydra­tion and fat-free mass density (Table 11.5).
Table 11.5 Median values for males for hydration, density, and constants (C1 and C2) for the paediatric version of Siri's equation, obtained by using the LMS (lambda-mu-sigma) method. Data from Wells et al. (2010) who also present comparable data for females.
Age Hydration
(%)
Density
(kg/L)
C1 C2
5 76.5 1.0827 5.36 4.95
6 76.3 1.0844 5.32 4.90
7 76.1 1.0861 5.28 4.86
8 75.9 1.0877 5.24 4.82
9 75.7 1.0889 5.21 4.79
10 75.5 1.0900 5.19 4.76
11 75.3 1.0911 5.16 4.73
12 75.2 1.0917 5.15 4.72
13 75.0 1.0920 5.14 4.71
14 74.8 1.0927 5.13 4.69
15 74.4 1.0942 5.09 4.66
16 74.0 1.0960 5.05 4.61
17 73.7 1.0978 5.02 4.57
18 73.5 1.0991 4.99 4.54
19 73.4 1.1000 4.97 4.52
20 73.3 1.1006 4.96 4.51
They reported the meas­ured fat-free mass density for the children to be sig­nif­icantly lower than the adult value (1.0864kg/L vs. 1.1kg/L), whereas that for the meas­ured fat-free-mass hydration was higher (75.3% vs. 73.2%). In a later study comprising a larger sample of children (n=533) and wider age range (4‑23y), Wells et al. (2010) developed empirical refer­ence data for density and hydration of fat-free mass for children from age 5‑20y based on the 4‑com­ponent model (i.e., body weight, total body water, bone mineral content, and body volume). Table 11.5 presents the median values for hydration, density, and constants (C1 and C2). In addition, they developed pre­dic­tion equations for the density and hydration of the fat-free mass based on age, sex, and body mass index standard devia­tion score (BMI SDS) using their 4‑com­ponent meas­ure­ments of body compo­sition; see Wells et al. (2010) for more details.

Note that the values for C1 and C2 constants for the adult males (age 20y) shown here are similar to the corres­ponding values shown in the Siri equation above (i.e., 4.95 for C1 and 4.50 for C2), whereas for adult females, the corres­ponding values are slightly lower: 4.90 for C1 and 4.44 for C2 at 20 y. With the sub­stitu­tion of the age- and sex-specific C1 and C2 constants in Table 11.5 for the C1 (4.95) and C2 (4.50) constants in the Siri equation, the accuracy of the two-com­ponent model for estim­ating fat mass of a healthy pediatric pop­ulation could be improved.

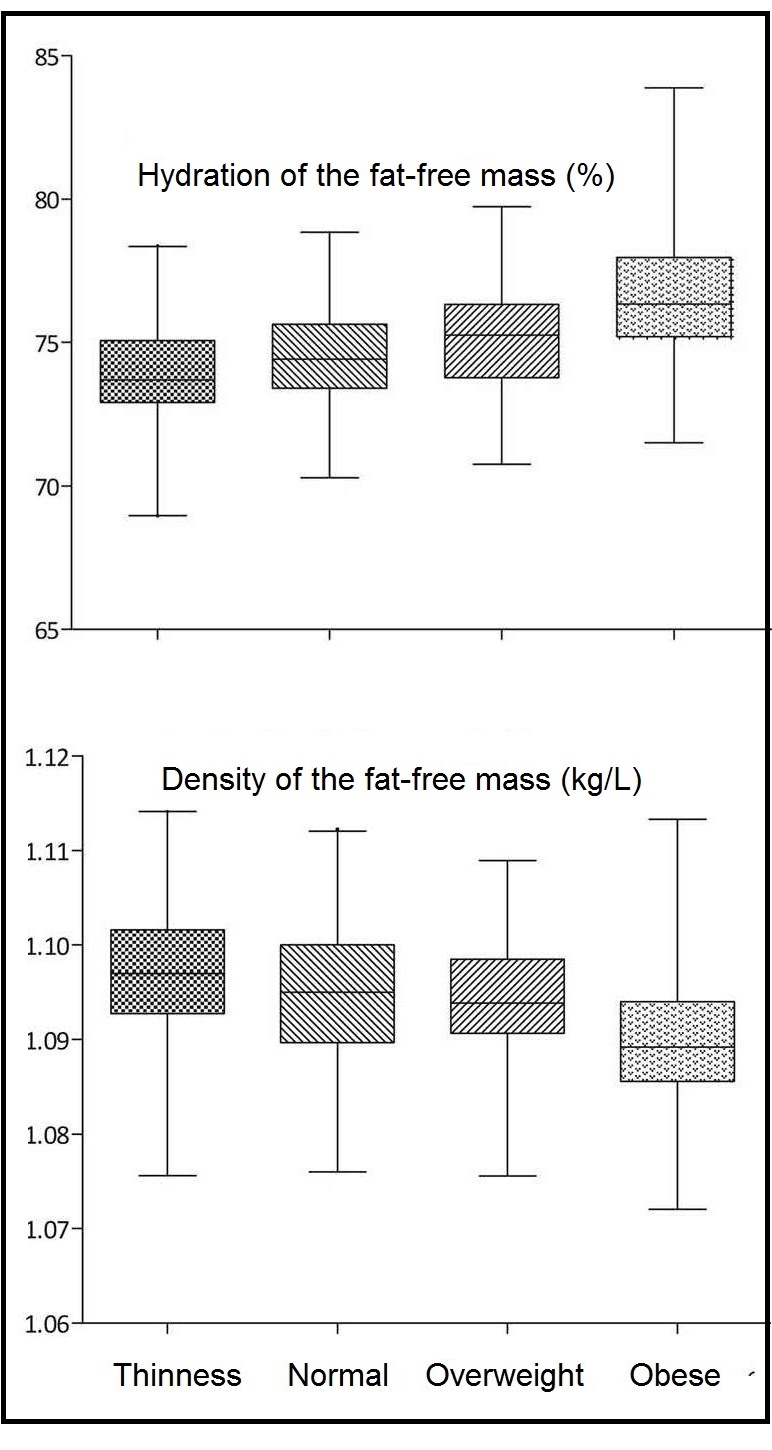
More recent research indicates that nutrit­ional status should also be con­sidered when selec­ting values for both the density and hydra­tion of fat-free mass using a two-com­ponent model for body compo­sition. Gutierrez-Martin et al. (2019) reported increas­ing values for hydration but decreasing values for the density of fat-free mass in the children with heavier BMIs (Figure 11.7), a trend that has been observed earlier in children (Haroun et al., 2005) and adults (Waki et al., 1991).

Figure 11.7
Figure 11.7 Values for hydration and density of fat free mass based on the four-com­ponent model and stratified by nutritional status grouped by BMI SD score for UK subjects aged 4‑22y. Redrawn and abbreviated from Gutierrez-Marin et al. (2019).

Consequently, these investigators developed a method whereby corrections for the density of fat-free mass could be made for children with obesity and thus improve the accuracy of the two-com­ponent model for estim­ating fat mass in obese children. For more details of the adjust­ment process, see Gutierrez-Martin et al. (2021).

Similar trends in the values for the hydration and density of fat-free mass com­pared to the classic adult values applied in the Siri den­sito­metric equation have been observed among older adults aged > 60y; values for fat-free mass density were lower but higher for the hydration fraction. These measure­ments were reported in studies of both Hispanic Americans (Gonzalez-Arellanes et al., 2019). and obese Mexicans` (González-Arellanes et al., 2021) aged > 60y and were based on the 4‑com­ponent model. Their findings also suggest that modifying the assumptions regarding both the density and hydration values for fat-free mass applied in the classical den­sito­metric empirical equations may also be appro­priate for the elderly and in conditions of obesity.

Recognition for the need to modify these classical empir­ical equa­tions which assume constant proper­ties of fat-free mass (hydration and density) has led to an increase in the measure­ment of body compo­sition in vivo using the 4‑com­ponent model. This method is con­sid­ered the gold standard for measur­ing body compo­sition because it reduces the need for theoret­ical assump­tions. See Chapter 14 for more discus­sion of the in vivo methods used to measure body compo­sition.

11.1.6 Waist-hip cir­cum­fer­ence ratio

The waist-hip cir­cum­fer­ence ratio (waist cir­cum­fer­ence divided by hip cir­cum­fer­ence) (WHR) is a simple method for distinguishing between fatness in the lower trunk (hip and buttocks) and fatness in the upper trunk (waist and abdomen areas). Lower trunk fatness (i.e., lower waist to hip ratio) is often referred to as “gynoid obesity” because it is more typical of females. Upper trunk or central fatness (higher waist to hip ratio) is called “android obesity” and is more characteristic of males. Never­the­less, obese men and women can be, and often are, classified into either group.

The fat depots assessed by the WHR are mainly sub­cut­aneous (exter­nal or outer) and vis­ceral (inter­nal or deep). Use of the WHR rose dramatic­ally follow­ing several reports confirming that WHR separately or in combin­ation with BMI was assoc­iated with increased risk of death, coronary heart disease and type 2 diabetes mellitus (Krotkiewski et al., 1983; Larsson et al., 1984).

The applic­ation of new labor­atory methods including com­puter tomog­raphy and magnetic resonance imaging has led to semi-quant­itative estim­ates of the total fat stored within the abdomen (i.e., intra-abdom­inal fat). Ashwell et al. (1985) were the first investigators to show highly significant correlations between intra-abdom­inal fat (visceral adipose tissue) and the ratio of waist-to-hip cir­cum­fer­ence. Their findings led to the proposal that the meta­bolic compli­cations of obesity shown to be assoc­iated with a high WHR, may be related specifically to the amount of intra-abdom­inal (visceral) fat. Recently, in a meta-analysis of 21 pro­spec­tive cohort studies in which waist-hip ratio was meas­ured as an indic­ator of abdom­inal obesity, the risk of cardio­vas­cular disease rose contin­ually with the increase in WHR when they exceeded a certain range (Xue et al., 2021). Based on these results the investigators advised that men should keep their WHR below 0.9 to maintain cardio­vas­cular fitness, whereas women should keep their WHR as small as possible within the normal range.
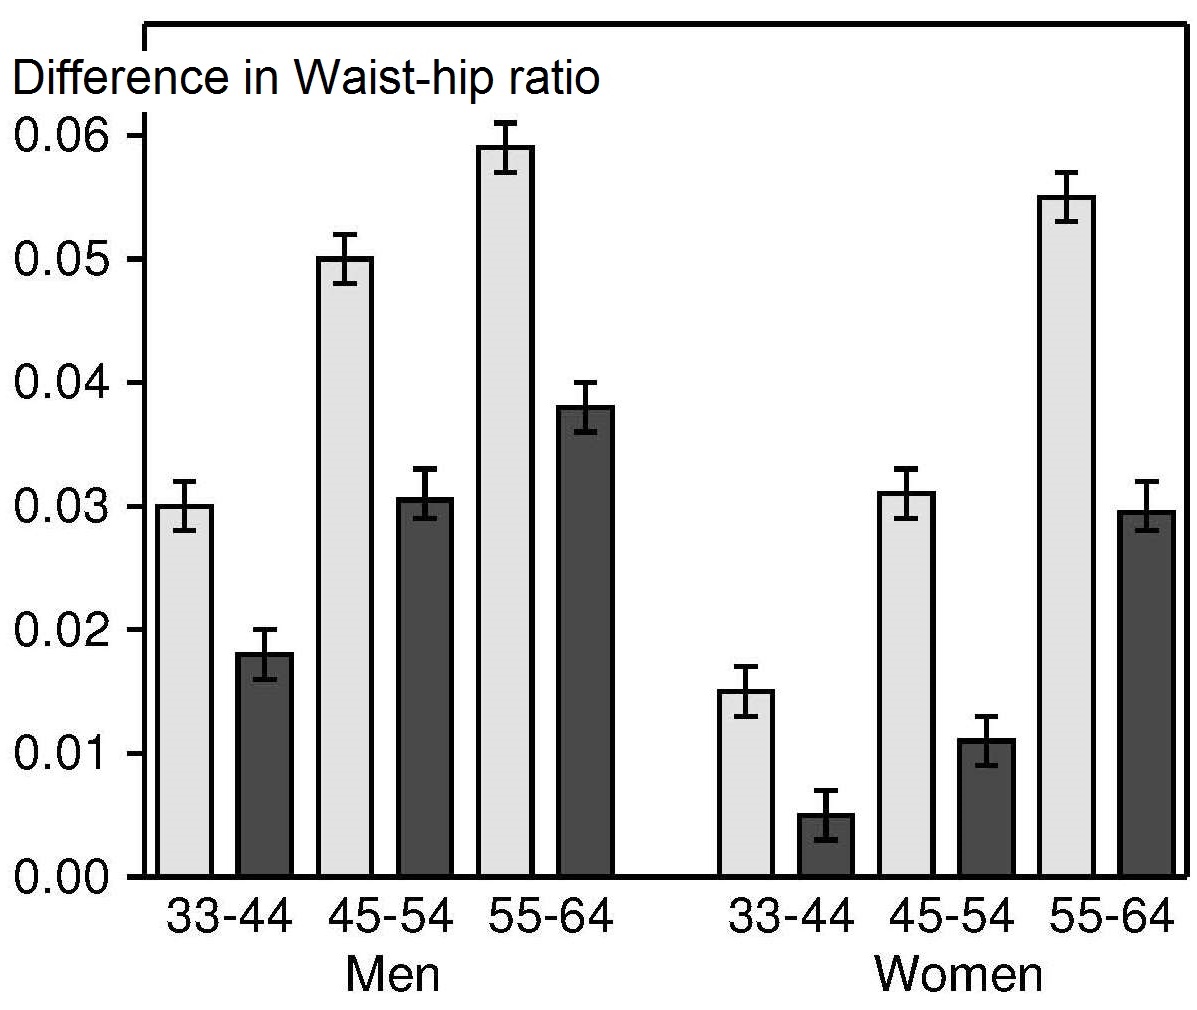
Figure 11.8
Figure 11.8. Effect of age on waist-hip ratio (WHR) shown by the difference in WHR in older subjects relative to the WHR at age 25-34y. Pooled data from 19 male and 18 female populations in the second MONitoring trends and determinants in CArdiovascular disease (MONICA) survey. Unadjusted differences (GREY - adjusted only for population) and adjusted differences (BLACK - adjusted for population, height and body mass (BMI). Redrawn from Molarius et al. (1999).

Several studies in adults have shown that the WHR varies with age and the degree of over­weight, in addition to sex (Stevens et al., 2010). Jones et al. (1986) meas­ured the WHR of a semi-random, age-strat­ified sample of 4349 British Caucasian men 20‑64y. They noted that the ratio increased with both age (curvi­linearly) and exces­sive weight. In the WHO multi­national MONItoring of trends and deter­minants of CArdio­vascular disease (MONICA) project (Molarius et al., 1999), the WHR was also reported to increase with age in both men and women (Figure 11.8), and to be higher in men than in women.

There is also some evidence that WHR varies with eth­nicity. In the MONICA project, a stan­dard pro­to­col was used to measure waist and hip cir­cum­fer­ence in men and women age 25‑64y in 19 countries. Mean waist-hip ratio varied con­sid­erably among the study popul­ation, ranging from 0.87‑0.99 for men and from 0.76‑0.84 for women. To date, most of the evidence for race/ethnic differences relates to Asian adults in whom lower WHRs have been associ­ated with an increased meta­bolic risk com­pared to Europeans, prob­ably because of higher body fat and visceral adipose tissue (Lear et al., 2010).

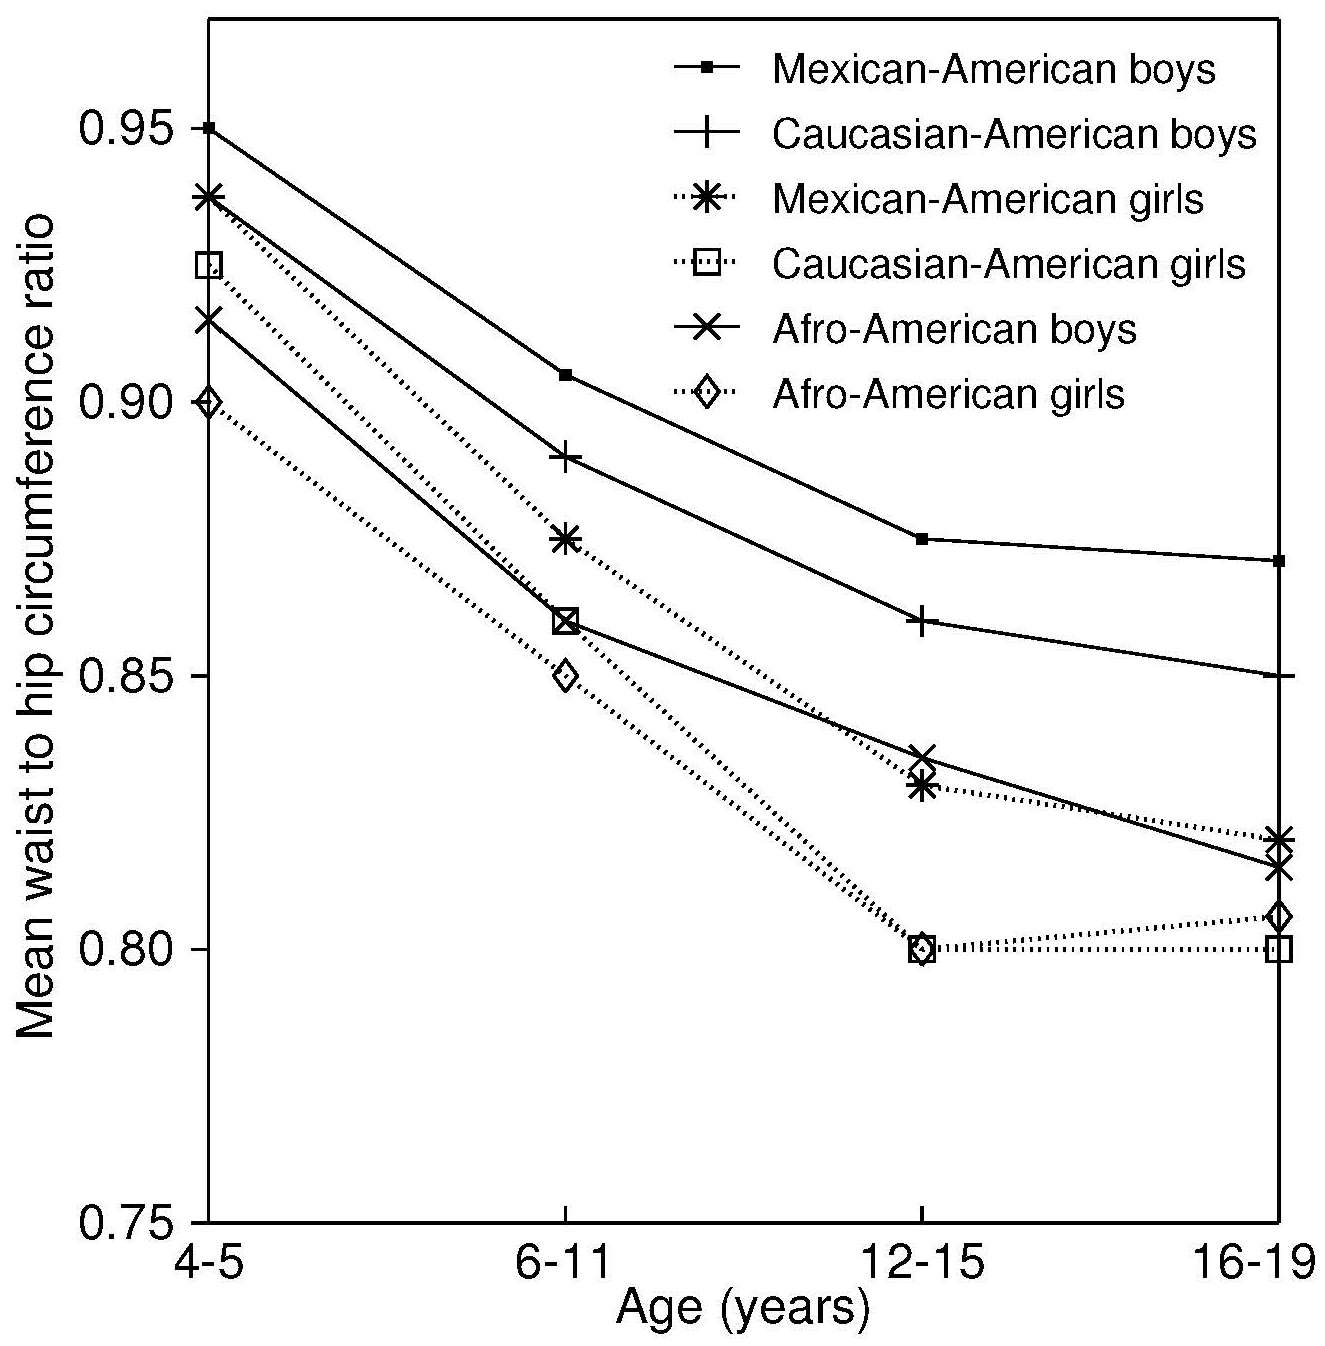
Relationships between the WHR and age, sex, and race/ethnic­ity have also been invest­igated in children. In the U.S. NHANES III, mean WHR varied con­sist­ently with age, sex, and ethnic group in children and adol­escents aged 4‑19y, as shown in Figure 11.9. Ratios were highest in Mexican Amer­ican boys (Gillum, 1999).

Figure 11.9
Figure 11.9. Mean waist-to-hip cir­cum­fer­ence ratio in male and female children and young adults of three racial groups. NHANES III data (1988-1994). Redrawn from Gillum (1999).

A variety of adverse health outcome measures have been examined in relation to WHR, most of which have been based on cross-sectional studies using differing methods to measure WHR. Con­sequ­ently, compar­isons across studies are difficult, as empha­sized by Lear et al. (2010). How­ever, in a pro­spec­tive cohort study involving 15062 participants from Norfolk, U.K., WHR appeared to have the best pre­dic­tive value for cardio­vascular disease and mort­ality com­pared with BMI and per­cent­age body fat (Myint et al., 2014). In some pro­spec­tive studies, WHR has been assoc­iated with a higher risk for all-cause and cardio­vascular mor­tality partic­ularly in women (Rost et al., 2018).

Measurement of waist-hip ratio

WHO (2011) has recom­mended stan­dard­ized protocols for the measure­ments of waist and hip cir­cum­fer­ence for inter­nat­ional use. WHO (2011) consid­ered the follow­ing elements when devel­oping the protocols: anat­om­ical place­ment of the measur­ing tape, its tight­ness, and the type of tape used; the sub­ject's posture, phase of respir­ation, abdom­inal tension, stomach con­tents, and cloth­ing.

After an extensive review, WHO (2011) concluded that waist cir­cum­fer­ence should be meas­ured at the mid­point between the tenth rib (i.e., the lowest rib margin) and the top of the iliac crest, using a stretch-resistant tape that provides a constant 100g tension. Hip cir­cum­fer­ence should be meas­ured around the widest portion of the but­tocks, with the tape parallel to the floor.

To perform the waist-cir­cum­fer­ence measure­ment, the lowest rib margin is first located and marked with a felt tip pen. The iliac crest is then palpated in the mid­axil­lary line and the top of the iliac crest is also marked. An elastic tape can then be applied horiz­ontally at the mid-point between the lowest rib margin and the highest point of the iliac crest: it is tied firmly so that it stays in position around the abdomen about the level of the umbil­icus. The elastic tape thus defines the level of the waist cir­cum­fer­ence, which can then be meas­ured by position­ing the stretch-resis­tant tape over the elastic tape (Jones et al., 1986). Alternatively, a wash­able marker can be used to land­mark the loca­tion of the tape. The stretch-resis­tant tape used for the measure­ment should provide a constant 100g tension. This can be achieved through the use of a special indicator buckle that reduces dif­feren­ces in tight­ness.

The subject should wear little clothing and be asked to stand erect with feet close together, arms at the side, with their body weight evenly distrib­uted across the feet. The subject should be relaxed and asked to take a few deep, natural breaths. The measure­ment should be taken at the end of a normal expir­ation to prevent the subject from con­tract­ing their muscles or from holding their breath. The measure­ment is taken when the tape is parallel to the floor, and the tape is snug, but does not com­press the skin. The reading is taken to the nearest milli­meter. Each measure­ment should be repeated twice. If the two measure­ments are within 1cm of one another, the average should be calculated, but if the difference exceeds 1cm, then the two measure­ments should be repeated.

For the hip cir­cum­fer­ence measure­ment, the subject should stand erect with arms at the side and feet together, with body weight equally distrib­uted across the feet. The measure­ment should be taken with the stretch-resis­tant tape used for the waist cir­cum­fer­ence measure­ment at the point yield­ing the maximum cir­cum­fer­ence over the buttocks. The tape must be held parallel to the floor, touching the skin but not indent­ing the soft tissue. The measure­ment is taken to the nearest millimeter. Again, each measure­ment should be taken twice. If the two measure­ments are within 1cm of one another, the average should be calculated, but if the difference exceeds 1cm, then the two measure­ments should be repeated. The degree to which factors such as post­pran­dial status, standing position, and depth of inspir­ation contribute to error in the measure­ment of waist-hip cir­cum­fer­ence ratio is uncertain.

Interpretive criteria

Bjôrntorp (1987) was the first to suggest that waist-hip ratios > 1.0 for men and > 0.85 for women indicated abdominal fat accum­ulation and an increased risk of cardio­vas­cular com­plic­ations and related deaths. Sub­sequ­ently, many coun­tries and settings have identified sex-specific cutoff points for WHRs, some also recom­mending ethnic­ally based cutoff points particularly for pop­ula­tions of Asian descent. Generally, most of the cutoffs chosen have been based on disease risk (e.g., cardio­vascular disease, type 2 diabetes and risk factors of cardio­vascular disease) and on hard outcomes such as mortal­ity. Japan is an exception as their cutoffs are based on assess­ment of visceral adipose tissue from com­puter­ized tomog­raphy, and hence on the extent to which meas­ure­ments pre­dict intra-abdom­inal fat rather than disease risk (WHO, 2011).

Currently, WHO (2011) define abdominal obesity and risk of meta­bolic consequences as a WHR > 0.90 for men and WHR > 0.85 for women. The cutoffs recommended by the U.S. Department of Health and Human Services for WHR are > 0.95 for men and > 0.80 for women.

WHO (2011) emphasize that further studies are needed to establish whether cutoff points for WHRs should be specific to age and ethnicity, given the known ethnic vari­ations in body fat distri­bution, especially in pop­ulations of Asian origin (Wagner & Heyward, 2000; Lear et al., 2010). Further, dif­fer­ent con­tri­butions of muscle mass and bone structure, as well as stature and abdom­inal muscle tone, may all lead to dif­ferent assoc­iations between WHR and abdom­inal fat accum­ulation.
Figure 11.10
Figure 11.10 Visceral adipose tissue area and liver attenuation by WC tertiles within each BMI category in men. Redrawn from Nazare et al. (2015), who also present data for women.

The validity of serial measure­ments of WHR to measure changes in intra-abdom­inal visceral fat over time is uncer­tain. For example, any bene­ficial reduc­tions in abdom­inal fat will not be evident when a ratio such as WHR is used if both the numer­ator and denom­inator values change in response to treatment. Con­sequently, waist cir­cum­fer­ence alone is now the pre­fer­red index for monit­oring loss of visceral adipose tissue, and is discus­sed below.

11.1.7 Waist cir­cum­fer­ence

Studies have shown that com­pared with the WHR, waist cir­cum­fer­ence alone is more strongly associ­ated with the amount of intra-abdom­inal fat (i.e., visceral fat tissue) (Snijder et al., 2006; Neeland et al., 2019). Moreover, with an increase in waist cir­cum­fer­ence, there is a corres­ponding increase of visceral adipose tissue, the fat depot known to convey the strongest health risk. For example, in a large study in 29 countries waist cir­cum­fer­ence and BMI were meas­ured, and visceral adipose tissue assessed directly using com­puter tomog­raphy (Nazare et al., 2015). A global cardio­vascular risk score was also calcu­lated from the sum of eight individual risk factor subscores based on a series of clinical bio­markers, all meas­ured in one labor­atory. As shown in Figure 11.10, visceral adipose tissue increased sig­nif­icantly while liver attenuation (inversely corre­lated with liver fat, a depot of ectopic fat) decreased significantly across the waist cir­cum­fer­ence ter­tiles, within each of the three BMI categories. Further, the meas­ured cardio­meta­bolic risk score reflec­ting the number of cardio­meta­bolic abnor­mal­ities, was signif­icantly cor­related to visceral adipose tissue, waist cir­cum­fer­ence, and BMI in men and women.

Table 11.6 Cardiometabolic risk score (CMR score) values across tertiles of waist cir­cum­fer­ence (WC) within each of the 3 body mass index (BMI) categories
*p < 0.05, **p < 0.01, ***p < 0.0001, denote significantly dif­fer­ent from the first WC tertile group within the same BMI category and
†p < 0.05, ††p < 0.01, †††p < 0.0001 denote significantly dif­fer­ent from the middle WC tertile group within the same BMI category.
T1, T2 and T3 are the WC tertile groups. All statistical analyses were adjusted for age, ethnicity, physician’s specialty, smoking status and educational level. BMI = body mass index; CMR = cardiometabolic risk; WC = waist cir­cum­fer­ence. Data are CMR score means ±SEM. Data from Nazare et al. (2015).
WC tertiles
T1 T2 T3
Men - BMI>
< 25kg/m2 WC ≤ 84cm
2.1 ± 0.1
84 < WC ≤ 90cm
2.5 ± 0.1**
WC > 90cm
2.7 ± 0.1***
25kg/m2
to < 30kg/m2
WC ≤ 95cm
2.7 ± 0.1
95 < WC ≤ 101cm
3.3 ± 0.1**
WC > 101cm
3.6 ± 0.1***
≥ 30kg/m2 WC ≤ 108cm
3.7 ± 0.1
108 < WC ≤ 116cm
4.1 ± 0.1*
WC > 116cm
4.5 ± 0.1 **†
Women - BMI>
< 25kg/m2 WC ≤ 76cm
1.5 ± 0.1
76 < WC ≤ 83cm
1.9 ± 0.1**
WC > 83cm
2.7 ± 0.1***†††
25kg/m2
to < 30kg/m2
WC ≤ 87cm
2.5 ± 0.1
87 < WC ≤ 93cm
3.3 ± 0.1***
WC > 93cm
3.8 ± 0.1***††
≥ 30kg/m2 WC ≤ 100cm
3.4 ± 0.1
100 < WC ≤ 108cm
3.8 ± 0.1
WC > 108cm
4.6 ± 0.1**††
Table 11.6 presents a com­par­ison of the cardio­meta­bolic risk scores by waist cir­cum­fer­ence tertile groups in each of the three BMI categories. Note the increase in cardio­meta­bolic risk score for both males and females in all three categories of BMI across the waist cir­cum­fer­ence tertile groups.

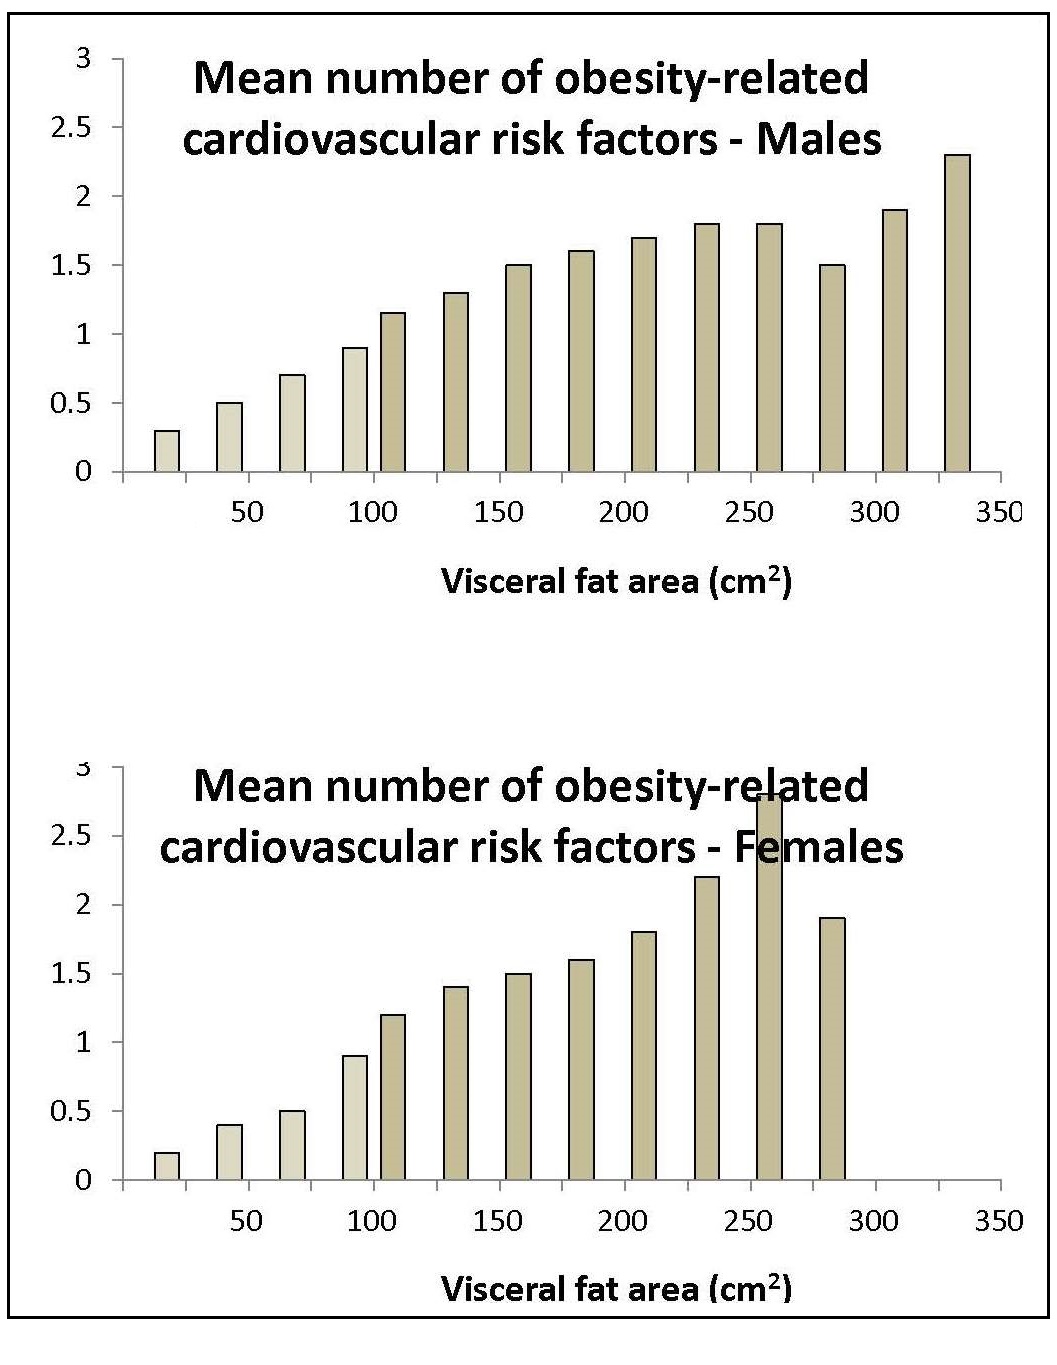
Data from numerous other epi­demio­logical studies have also shown that visceral adipose tissue is an inde­pen­dent risk marker of cardio­vascular and meta­bolic mor­bid­ity and mor­tal­ity. A study by Hiuge-Shimizu et al. (2012) on vis­ceral fat accum­ula­tion, meas­ured on com­puter tomog­raphy scans in 12,443 Jap­anese sub­jects, indic­ated that an absolute visceral fat area of about 100cm2 equated with an increased risk of factors assoc­iated with obesity-related cardio­vas­cular mor­bid­ity. More­over, this relation­ship was irres­pective of gender, as shown in Figure 11.11, as well as age and BMI. The obesity-related cardio­vas­cular risk factors assessed in this study were hyper­gly­cemia, dys­lipid­emia, and ele­vated blood pressure.

Figure 11.11
Figure 11.11 Association between the mean visceral fat area (VFA) and obesity-related cardio­vascular risk factors. Pale bars: subjects with less than 1.0 risk factors; darker bars: subjects with more than 1.0 risk factors. Redrawn from Hiuge-Shimizu et al.

These findings have high­lighted the import­ance of measur­ing waist cir­cum­fer­ence along with BMI in clin­ical practice to assess the dis­trib­ution of visceral (intra-abdom­inal) adipose tissue between indiv­iduals (Ross et al., 2020). Moreover, hip cir­cum­fer­ence is more diffi­cult to measure than waist cir­cum­fer­ence. (2012).

Listed below are the health and meta­bolic abnor­mal­ities that have been associ­ated with an excess deposition of visceral adipose tissue and ectopic fat irre­spec­tive of total adiposity estim­ated by BMI (Neeland et al., 2019).


● Insulin resistance
● Impaired glucose tolerance
● Type 2 diabetes
● Cardiovascular disease
     ○ Hypertension
     ○ Heart failure
     ○ Coronary heart disease, myocardial infarctions
     ○ Valve diseases
     ○ Arrhythmias

● Respiratory diseases
     ○ Sleep apnoea
     ○ Chronic obstructive pulmonary disease

● Brain health
     ○ Stroke, necrosis
     ○ Reduced brain size
     ○ Reduced grey matter
     ○ Reduced cognitive function
     ○ Dementia

● Cancers
● Others
     ○ Reduced bone density
     ○ Polycystic ovary syndrome
     ○ HIV infection and antiretroviral therapy as
     both can contribute to the accumulation
     of visceral adipose tissue and ectopic fat.

Note, however, that the evidence for a causal relation with some of these condit­ions is insuf­ficient. For more details of the constel­lation of meta­bolic abnorm­alities associ­ated with an excess of visceral adipose tissue, see Neeland et al. (2018).

More recently, with the devel­op­ment of medical imaging, the detection and measure­ment of fat in areas of the body where fat is not physio­logically stored has also been made. These studies have shown that at any given BMI, excess visceral adiposity is often assoc­iated with an increased accum­ulation of fat in nor­mally lean tissues such as the liver, pancreas, heart, and skel­etal muscle, a con­dition termed ectopic fat depos­ition. As noted earlier, emerging evidence suggests that the depos­ition of ectopic fat might contribute to increased risk of athero­scler­osis and cardio­meta­bolic risk (Neeland et al., 2019).

The causal mechanisms whereby an excess of visceral adipose tissue is related to the cardio­meta­bolic compli­cations are not yet fully estab­lished. Three mutually exclusive scenarios have been proposed, and are reviewed by Neeland et al. (2019):

Figure 11.12
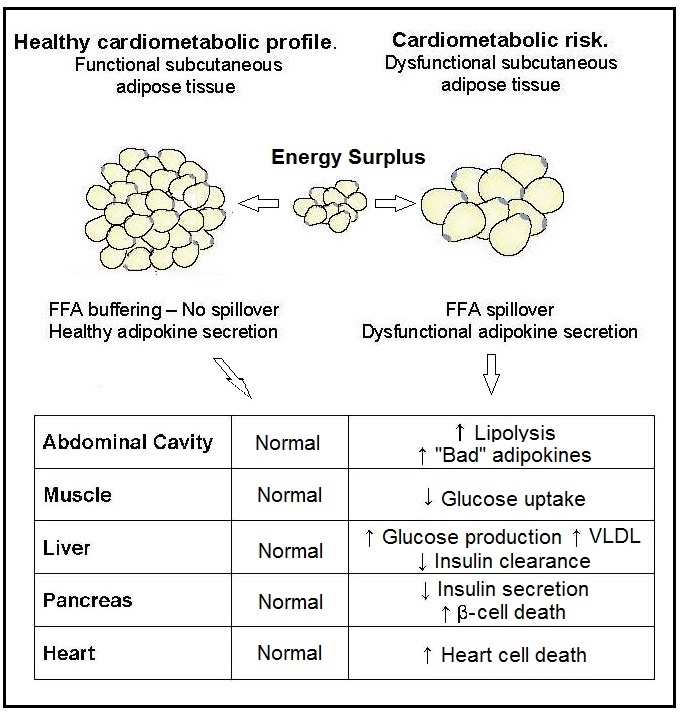
Figure 11.12 Overview of potential role of functional and dys­func­tional adipose tissue contributing to increased cardio­meta­bolic risk. FFA = free fatty acid; VLDL = very-low-density lipoprotein cholesterol. Redrawn from Ross et al. (2020).

An overview of the potential role of func­tional and dys­func­tional adipose tissue contrib­uting to increased cardio­meta­bolic risk is presented in Figure 11.12. In a healthy cardio­meta­bolic profile, the ability of subcutaneous adipose tissue to expand through hyperplasia (generation of new fat cells) allows the safe storage of the excess energy from the diet into a properly expanding subcutaneous 'meta­bolic sink'. When this process becomes saturated or in a situation where adipose tissue has a limited ability to expand, there is a spillover of the excess energy, which must be stored in visceral adipose tissue as well as in normally lean organs such as the skeletal muscle, the liver, the pancreas, and the heart, a process described as ectopic fat deposition. Visceral adiposity is associ­ated with a hyper­lipo­lytic state resistant to the effect of insulin along with an altered secretion of adipokines including inflammatory cytokines, whereas a set of meta­bolic dysfuntions are specifically associ­ated with increased skeletal muscle, liver, pancreas, and epicardial, pericardial, and intra-myocardial fat. For more discussion, see the con­sen­sus documents by the Inter­national Athero­scler­osis Society (IAS) and International Chair of Cardiometabolic Risk (ICCR) Working Group on Visceral Obesity (Neeland et al., 2019; Ross et al., 2020).

Neeland et al. (2019) have also reviewed the response of visceral and ectopic fat to treat­ment. Briefly, both exercise and dietary inter­vent­ions are report­edly assoc­iated with a sub­stan­tial reduc­tion in visceral adipose tissue inde­pen­dent of age, sex, and ethnic origin, and irres­pective of amount or intensity of exercise. More­over, ran­dom­ized control­led trials that have reported life­style-induced reduc­tions in visceral adipose tissue and thus waist cir­cum­fer­ence have also shown they are assoc­iated with improve­ments in cardio­meta­bolic risk factors with or without corres­ponding weight loss.

These obser­vations, taken together, emphasize the impor­tance of devel­oping simple clin­ically applic­able tools, pre­viously vali­dated with imaging data, with the ability to monitor changes in visceral and ectopic fat over time (Neeland et al., 2019; Ross et al., 2020). In this way, the definition of high-risk over­weight and obesity could be refined. In the meantime, Neeland et al. (2019) suggest that the addition of the measure­ment of plasma tri­glyc­eride con­cen­trat­ions to the measure­ments of waist cir­cum­fer­ence may be help­ful as a screen­ing tool to identify indiv­iduals likely to be char­act­erized by the cluster of abnorm­alities of the meta­bolic syndrome, as long as vali­dated waist cir­cum­fer­ence cutoff values are applied.

Measurement of waist cir­cum­fer­ence

A con­sen­sus on the optimal protocol for the measure­ment of waist cir­cum­fer­ence has not yet been reached. Currently two sites are used: (a) at the natural waist, i.e., mid-way between the tenth rib (the lowest rib margin) and the iliac crest (i.e., the super­ior border of the wing of the ilium), as proposed by WHO (2011) and (b) at the umbilicus level (van der Kooy & Seidell, 1993). In the future, adopt­ing a standard approach by using the proto­col described by WHO (2011) and described in Section 11.1.7, is recom­mended. In this way differences that might exist in absolute waist cir­cum­fer­ence measure­ments due to the difference in protocols will be avoided (Ross et al., 2020).

Interpretive criteria

Waist cir­cum­fer­ence cutoffs in adults have been developed as simple surrogate markers to identify the increased risk associ­ated with excess visceral adi­pose tissue (intra-abdominal fat). Consequ­ently, measure­ments of waist cir­cum­fer­ence should be included routinely along with BMI by health practitioners in the eval­uation and manage­ment of patients with over­weight and obesity (Ross et al., 2020).

In several countries a single cutoff threshold for white adults (> 102cm for men and > 88cm for women) is currently used to denote a high waist cir­cum­fer­ence, irres­pective of BMI category (Molarius et al., 1999; Health Canada, 2003). These same sex-spec­ific cut­offs have been pro­posed by WHO (2011). They were based on cross-sect­ional data in Cauc­asian adults in whom the specified sex-spec­ific waist cir­cum­fer­ence cutoffs corresponded to a BMI of 30.0kg/m2, the BMI cutoff designated for obesity. Hence, they were not developed based on the relation­ship between waist cir­cum­fer­ence and adverse health risk (Ross et al., 2020).

WHO (2011) recognized that population-specific cutoffs may be warranted in view of differences in the level of risk associ­ated with a parti­cular cutoff across pop­ulat­ions, depend­ing on levels of obesity and other risk factors for cardiovascular disease and type 2 diabetes. How­ever, they empha­size that further prospec­tive studies using rep­resent­ative pop­ulations are needed to under­stand the genetic and life­style factors that may be contributing to the reported regional var­iations in waist cir­cum­fer­ence (Lear et al., 2010). Con­sequ­ently, to date, WHO (2011) have not recom­mended ethnicity-spec­ific cutoffs for waist cir­cum­fer­ence.

Never­the­less, ethnicity-specific cutoffs for waist cir­cum­fer­ence for adults have been devel­oped by several invest­igators (Table 11.7); most have been optim­ized for the iden­tif­ication of adults with ele­vated cardio­vas­cular risk, except those for Japanese adults, in whom a visceral adipose tissue volume > 100cm3 was applied (Hiuge-Shimizu et al., 2012).
Table 11.7 Waist cir­cum­fer­ence (cm) for adults above which cardiometabolic risk is elevated. Japanese waist cir­cum­fer­ence values are thresholds above which visceral adipose tissue volume is > 100cm3. The original data sources, along with this summary are given in Ross et al. (2020).
Ethnic Group Men Women
Japanese ≥ 85 ≥90
Jordanian ≥ 98 ≥ 96
Chinese ≥ 80 ≥ 80
Korean ≥ 90 ≥ 85
Tuisian ≥ 85 ≥ 85
Iranian ≥ 89 ≥ 91
Asian Indian ≥ 90 ≥ 80
Most of the values in this table were derived from cross-sect­ional data rather than pro­spec­tive studies using rep­resent­ative pop­ulations and were not con­sid­ered in assoc­iation with BMI. Of note is the wide range in high-risk waist cir­cum­fer­ence values for both adult men (80‑98cm) and women (80‑96cm).

In the future Ross et al. (2020) recom­mend conduc­ting pro­spec­tive studies using rep­resen­tative pop­ulat­ions to address the need for BMI cate­gory-spec­ific waist cir­cum­fer­ence cutoffs across dif­ferent ages, and by sex and eth­nicity. Such data have been developed only for Caucasian adults by Ardern et al. (2004) and are sum­marized in Table 11.8. These inves­tigat­ors reported that in both sexes, the use of BMI cate­gory-spec­ific waist cir­cum­fer­ence cutoffs improved the iden­tific­ation of indiv­iduals at high risk of future coronary events. These results were confirmed in a later study in which the prog­nostic performance of the Ardern waist cir­cum­fer­ence values was com­pared with the trad­itional U.S. waist cir­cum­fer­ence cut­offs assoc­iated with high cardio­meta­bolic risk (i.e., > 88cm for Caucasian women; > 102cm for Caucasian men). Again, strat­ification of waist cir­cum­fer­ence cutoffs by BMI sub­stant­ially improved pre­dic­tions of mort­ality com­pared with the trad­itional waist cir­cum­fer­ence cut­offs for U.S. Caucasian adults of both sexes (Bajaj et al., 2009).

Table 11.8 Waist cir­cum­fer­ence thresholds (cm) stratified by BMI for white individuals. Subjects with measure­ments higher than these values have a high risk of future coronary events (based on 10-year risk of coronary events or the presence of diabetes mellitus). Data from Ross et al. (2020).
BMI category (kg/m2) Women Men
Normal weight (18.5‑24.9) ≥ 80 ≥ 90
Overweight (25‑29.9) ≥ 90 ≥ 100
Obese I (30‑34.9 ) ≥ 105 ≥ 110
Obese II and III (≥35 ) ≥ 115 ≥ 125

Waist cir­cum­fer­ence is also a highly sensitive and specific marker of accumulation of central obesity in children. Several country-specific waist cir­cum­fer­ence percentile cutoffs for children have been developed (Goran & Gower, 1999; Nagy et al., 2014; Eisenmann, 2005; Serrano et al., 2021).

Recently, inter­national age‑ and sex-spec­ific waist cir­cum­fer­ence cutoffs to define central obesity for children and adol­escents aged 6‑18y have also been developed (Xi et al., 2020). Based on data from 8 countries (Bulgaria, China, Iran, Korea, Malaysia, Poland, Seychelles, Switzerland), the chosen cutoff is the 90th waist cir­cum­fer­ence percentile in children with normal body weight (based on BMI). This cutoff performed well to pre­dict cardio­vas­cular risk when based on avail­able data from 3 countries (China, Iran, Korea) on the presence of three or more of six cardio­vas­cular risk factors: sys­tolic blood pressure, dia­stolic blood pressure, total chol­est­erol, tri­glycer­ides, high-den­sity lipo­pro­tein chol­esterol (HDL‑C), low density lipo­pro­tein chol­esterol (LDL‑C), and fast­ing glucose.

Table 11.9 Age- and sex-specific waist circumference (WC) for the 90th percentile of WC during childhood. All esti­mates are calculated based on data excluding children with obesity, overweight or underweight based on the International Obesity Task Force BMI pediatric criteria. Data from Xi et al. (2020)
WC Cutoffs for Adult Central Obesity
MalesFemales
Age (y)P90cmP90cm
658.757.9
760.760.0
862.962.3
965.364.9
1067.867.5
1170.470.0
1272.872.2
1375.074.1
1477.075.5
1578.876.5
1680.377.2
1781.877.8
1883.278.4
The cal­culated 90th per­centile waist cir­cum­fer­ence values for children aged 6‑18y with normal weight (i.e., excluding those who were under­weight, over­weight, or obese) and based on the pooled data from 113,453 children in 8 countries, are shown in the sex-specific columns (Table 11.9). How­ever, more research is needed to further evaluate the performance of the proposed age‑ and sex-specific 90th percentile WC values in other populations. See Xi et al. (2020) for more details.

Figure 11.13
Figure 11.13 The prevalence of abdominal obesity and obesity measured in dif­fer­ent studies. Changes in the prevalence of abdominal obesity (measured using WC) and general obesity (measured using BMI) measured in dif­fer­ent studies during the time period indicated on the x axis. General obesity was defined as BMI ≥ 30kg/m2. Abdominal obesity was defied as WC ≥ 88cm and ≥ 102cm for women and men, respectively. Years given (for example, 1962‑2000) indicate the years in which the data were colllected. F = female; M = male. Redrawn from Ross et al. (2020).
Finally, emerging evidence suggests the rel­ative increases in waist cir­cum­fer­ence in adults are larger than the rel­ative increases in BMI across pop­ulat­ions (Visscher et al., 2015). This trend appears to be inde­pen­dent of age, and sex and ethnicity as shown in Figure 11.13 (Ross et al., 2020), and emphasizes that a single focus on BMI > 25 or > 30kg/m2 is likely to mask a real increase in the obesity epidemic. Clearly, waist cir­cum­fer­ence should be included along with BMI in all obesity sur­veil­lance studies in the future to ensure the phenotype of obesity that conveys the greatest health risk (i.e., abdominal obesity) is identified. This recommendation was made by the International Atherosclerosis Society (IAs) and the International Chair on Cardiometabolic Risk (ICCR) working group on visceral obesity. In addition, the working group have emphasized the impor­tance of research to refine the WC cutoffs for a given BMI category (Table 11.8) to optimize obesity risk stratification across age, sex, and ethnicity (Ross et al., 2020).

11.2 Assessment of fat-free mass

The fat-free mass consists of the skel­etal muscle, non-skel­etal muscle, organs, connective tissue, total body water, and the skel­eton (Earthman, 2015). Based on the two-com­ponent model, once total body fat has been estim­ated, then fat-free mass can be deter­mined, as shown below:

\[ \small \mbox{Total body fat (kg)} = \mbox{body weight (kg) × % body fat / 100} \]

\[ \small \mbox{Fat-free mass} = \mbox{body weight (kg) − body fat (kg)} \]

Therefore, the limit­ations outlined earlier when using anthro­po­metric variables to assess per­cent­age body fat based on the two-compo­nent model must also be consid­ered when assess­ing fat-free mass. Recog­nition of these limit­ations is espec­ially important when assess­ing fat-free mass in under­nourished children with edema (Wells & Fewtrell, 2006; Girma et al., 2016), and obese subjects (Gutiérrez-Marín et al., 2021). In these cir­cum­stan­ces, the assump­tions used to convert from raw measure­ments to final body compo­sition values (see Section 11.1.5) are often violated.

Muscle is a major compo­nent of the fat-free mass and the primary site for glucose uptake and storage as well as a reservoir of amino acids stored as protein, as noted earlier. Assess­ment of muscle mass can there­fore provide an index of the protein reserves of the body, which can be meta­bolized during periods of neg­ative nitrogen balance. Loss of muscle mass is an impor­tant criterion for the definition of mal­nu­trit­ion (Cederholm et al., 2019), and for the diag­nosis of sarco­penia in the elderly. Depleted muscle mass in mal­nour­ished children increases risk of mortal­ity during infec­tions (Briend et al., 2015), whereas in older adults, sarco­penia may be assoc­iated with several negative outcomes, including falls, frac­tures, and mobility dis­orders, cog­nitive impair­ments, and mortal­ity (Cruz-Jentoft et al., 2019).

Several simple, non-invasive anthro­pometric measure­ments based on mid-upper arm cir­cum­fer­ence (MUAC), either alone (Hu et al., 2021), or in combin­ation with triceps skin­fold thick­ness (i.e., arm-muscle cir­cum­fer­ence and arm-muscle area), are used as surro­gates for muscle mass in both clinical and com­munity settings. All three of these measure­ments have been shown to correlate with muscle mass assessed by in vivo labor­atory-based methods such as bio­elec­trical impedance analysis (BIA) (Hu et al., 2021), DXA, or computed axial tomo­graphy (Heymsfield et al., 1982; Carnevale et al., 2018). As a result, they have also been used to pre­dict changes in protein status in resource-poor settings, provided the changes are not small.

More recently, calf cir­cum­fer­ence and hand grip strength have also been recom­mended as tools to assess the amount and strength of muscle mass and identify older people at risk for sarco­penia in clinical prac­tice (Chen et al., 2020). These anthro­po­metric measure­ments and indices derived from them are dis­cussed below.

11.2.1 Mid-upper-arm cir­cum­fer­ence

The arm contains both sub­cut­aneous fat and muscle; a decrease in MUAC may there­fore reflect a reduc­tion in either muscle mass or sub­cut­aneous tissue (or both). In some low-income countries, where the amount of sub­cut­aneous fat is often small, changes in MUAC tend to parallel changes in muscle mass and, hence, are some­times used as in indi­cators of severe and moder­ately severe under­nutri­tion in young children (age < 5y) from resource-poor settings. Even in high-income settings, measure­ment of MUAC is recom­mended as one of the indi­cators of pediatric mal­nu­trition by the Academy of Nutri­tion and Diet­etics (AND) and the American Society for Parent­eral and Enteral Nutri­tion (ASPEN) (Becker et al., 2014). MUAC measure­ments are par­ticu­larly impor­tant for child­ren whose weight may be affected by edema, ascites, or steroids in the lower extrem­ities because of fluid retention (Mehta et al., 2013). Changes in the MUAC measure­ments can also be used to monitor progress during nutri­tional therapy.

The measure­ment of MUAC requires a minimal amount of time and equipment, and changes in MUAC are easy to detect. There­fore, increas­ingly, MUAC is used in emerg­encies such as famines and refugee crises for screen­ing children with severe acute mal­nutri­tion (SAM) or mod­erate acute mal­nutri­tion. In such situations, the measure­ment of weight or height may not be feasible, and ages of the children are often uncertain (de Onis et al., 1997). In addition, use of a weight-based nutrit­ional assess­ment (e.g., WLZ) can be mis­lead­ing in chil­dren with SAM who frequ­ently have diar­rheal disease accom­panied by dehyd­ration, which lowers the weight of a child. Modi et al. (2015) showed that MUAC out­per­formed weight-for-length Z‑score <  −3 to identify SAM in child­ren aged 6‑60mo with diarrhea.

The use of fixed cutoffs to dis­ting­uish normal and mal­nour­ished children assumes that MUAC is rel­atively inde­pen­dent of age for these children. How­ever, the age inde­pen­dence of MUAC has been questioned (Hall et al., 1993; Bern & Nathanail, 1995; WHO, 1995). This has led to the use of MUAC Z‑scores, that adjust for age and sex differences (Houssain et al., 2017).

Research in Somalia suggested improved con­cord­ance in prev­alence estim­ates for acute mal­nu­trition using MUAC-for-age Z‑scores rather than MUAC alone (Custodio et al., 2018). How­ever, Leidman et al. (2019) reported that the con­verg­ence with weight-for-height Z‑score data when MUAC-for-age Z‑score replaced MUAC alone was limited, based on data from pop­ula­tion surveys from 41 coun­tries. They con­cluded that the addit­ional estim­ation of age, required when using MUAC-for-age Z‑score, especially in human­itarian settings, was not just­ified. They urged the need for further research on morb­idity and mortal­ity of children with low MUAC-for-age Z‑scores.

Measurement of MUAC alone has also been used to detect over­weight and obesity in children and adol­escents in both low‑ and high-income set­tings due to the strong relation with body weight. Craig et al. (2014) con­cluded that MUAC may have poten­tial for clin­ical and sur­veil­lance application as an accurate indic­ator of over­weight and fat­ness in children and adoles­cence in place of BMI that requires measurements of both weight and stature. In their study of black South African children age 5‑14y, overweight was defined on the basis of BMI-for-age and over­fatness from body fatness via bio­elec­trical impedance (BIA) esti­mates of body fat­ness. Talma et al. (2019) meas­ured MUAC and BMI in children aged 2‑18y from the fifth Dutch Nation­wide Growth Study. They also concluded that in studies when weight and stature measure­ments are impos­sible, MUAC can be used as an altern­ative and valid measure for detect­ing over­weight and obes­ity. Cer­tainly, the results of cross-sectional data from 12 coun­tries rep­re­sent­ing five major geo­graphic regions of the world suggest that MUAC may be a promis­ing tool for obesity in resource-poor settings (Chaput et al., 2017).

A major application of MUAC in older adults is as a surrogate for appendicular skel­etal muscle mass, and the subsequent detection of sarco­penia (Pinheiro et al., 2020; Hu et al., 2021). MUAC is recom­mended because the measure­ment is less affected by fluid retention com­pared to the lower extremities, a con­dition that often occurs in older adults. Sarcopenia is char­acter­ized by decreases in muscle mass, as well as strength and func­tion, all of which have multiple adverse health con­sequ­ences, as noted earlier. Several studies have demon­strated that low MUAC is assoc­iated with an increased risk of all-cause mort­ality in adults (Weng et al., 2018). Some invest­igators have also used MUAC as a proxy for BMI measure­ments to classify adults as thin (Tang et al., 2020).

Measurement of mid-upper arm cir­cum­fer­ence

Measurements of MUAC should be made using a flexible, non-stretch tape made of fiberglass or steel; altern­atively, a fiber­glass insertion tape can be used. The subject should stand erect and side­ways to the meas­urer, with the head in the Frank­furt plane, arms relaxed, and legs apart. If the subject is wearing a sleeved garment, it should be removed or the sleeves should be rolled up. The measure­ment is taken at the mid­point of the upper arm, between the acromion process and the tip of the olecranon (Figure 11.14).
Figure 11.14
Figure 11.14 Use of insertion tape to measure mid-upper arm-cir­cum­ference. Redrawn from Robbins & Trowbridge (1984).
After locating the mid­point, the arm is extended so that it is hanging loosely by the side, with the palm facing inward. The tape is then wrapped gently but firmly around the arm at the mid­point (Figure 11.14), care being taken to ensure that the arm is not squeezed. MUAC is often meas­ured at the same time as triceps skin­fold. In the WHO Multi­centre Growth Refer­ence Study, MUAC (and skin­fold) measure­ments were taken on the left side of the body (de Onis et al., 2004).

The MUAC measure­ment tapes are cheap, widely avail­able, and easy to use so that cases of SAM can be readily iden­tified at the com­munity level. If neces­sary, MUAC can be meas­ured with subjects in the recum­bent position. In this case, a sandbag is placed under the elbow to raise the arm slightly off the surface of the bed (Chumlea et al.,1984). Measurements are taken to the nearest mm.

Precision of MUAC measure­ments, both within and between examin­ers, can be high, even if the subjects are obese, provided that trained exam­iners and stan­dard­ized methods are used. High pre­cision is critical as MUAC varies little at any given age, with measure­ments tending to form a narrow symmetrical distri­bution, so that even small errors are signif­icant. In the WHO Multi­centre Growth Refer­ence Study, the maximum allow­able dif­fer­ence for the dup­licate measure­ments of arm cir­cum­fer­ence was 5.0mm (de Onis et al., 2004).

Interpretive criteria

To classify acute malnu­trition in children (6‑59mos), a single MUAC cutoff irre­spec­tive of age (i.e., 125mm) is often used, as a proxy for low weight-for-height (i.e., WHZ < −2; wasting) (Leidman et al., 2019).

WHO (2009) recommends a MUAC cutoff of < 115mm to diagnose children aged 6‑60mo with severe acute malnutrition (SAM), together with the presence of bilateral pitting edema, where possible. Following treatment, the WHO dis­charge criteria recom­mended for chil­dren with SAM are a MUAC cutoff of > 125mm and no edema for at least 2wks (WHO, 2009).

The U.S Academy of Nutrition and Dietetics (AND) and the American Society for Paren­teral and Enteral Nutri­tion (ASPEN) also recommends MUAC cutoffs to classify bedbound children aged 6‑60mos with under­nutr­ition when measure­ments of weight and length or height are not feasible. For children clas­sified as sev­erely mal­nour­ished, a MUAC cutoff < 115mm is recom­mended, for moder­ately malnourished children, a MUAC cutoff of 115‑124mm, and for children at risk of malnutrition, a MUAC cutoff of 125‑134mm (Becker et al., 2014).

Chaput et al. (2017) suggest a MUAC cutoff of about 25cm (250mm) for both boys and girls to identify obesity in children 9‑11y, based on their 12 country study data. How­ever, from country-specific analyses, the cutoff value to identify obesity ranged from 23.2cm (boys in South Africa) to 26.2cm (girls in the UK; see Chaput et al. (2017) for more details.

There is no con­sen­sus on an optimal MUAC cutoff for thinness among adults, with reported cutoff values ranging from 17.0cm to 25.1cm. This discrepancy is in part due to the use of dif­fer­ent BMI cutoffs to define thinness (Philpott et al., 2021). Based on a meta-analyses strat­ified by gender, disease states, and geographies, a cutoff of < 24.0cm (240mm) has been claimed to adequately classify thinness across adult population groups (Tang et al., 2020).

Likewise, there is no con­sen­sus on the MUAC cutoff to pre­dict low muscle mass and diagnose sarco­penia in adults; cutoffs vary with sex, age, and possibly race-ethnicity. For community-dwelling Chinese adults > 50y, Hu et al. (2021) recommend MUAC cutoffs of < 28.6cm for men and < 27.5cm for women for predicting low muscle mass, and < 27cm for both sexes to identify sarco­penia. This cutoff was developed based on low muscle mass diagnosed using the European Working Group on Sarcopenia in Older People 2 (EWGSOP2) criteria. Whether these cutoffs are applicable for other race-ethnic groups warrants invest­igation.

Concern that use of a fixed MUAC cutoff would over diagnose wasting among younger children and under-diagnose among older children because of the depend­ence of MUAC on age, as noted earlier, led WHO to recom­mend the use of MUAC Z‑scores, which adjust for age and sex differences. Consequently, WHO has developed MUAC-for-age refer­ence data (Z‑scores and percent­iles by sex) for children aged 3‑60mo for inter­national use. The curves show both age-specific and sex-specific differ­ences for boys and girls aged < 24mos. Numerical Z‑score tables and charts for boys are also avail­able (WHO ICGS Arm Circ.).

Reference ranges for MUAC percent­iles are also avail­able for US children and ado­les­cents aged 1‑20y based on the same population used in the CDC body mass growth charts (Addo et al., 2017). The pecentiles for females are shown in Figure 11.15. The authors also provide percent­iles for males and the necessary LMS coef­ficients to calculate Z-scores.
Figure 11.15
Figure 11.15 Mid-upper-arm-cir­cum­fer­ence-for-age percentiles for female US children and adolescents aged 1‑20y. Redrawn from Addo et al. (2017).
It is noteworthy that for ages 2‑5y, median values for the MUAC curves for the US children were comparable to those of the WHO Multi­centre Child Growth Study. Predic­tive equations for height-for-age adjusted MUAC Z‑scores for males and females are also avail­able in Addo et al. (2017).

11.2.2 Mid-upper-arm-muscle cir­cum­fer­ence

The muscle cir­cum­fer­ence of the mid-upper arm is derived from measure­ments of both the MUAC and triceps skin­fold thick­ness and is the calculated cir­cum­fer­ence of the inner circle of muscle sur­rounding a small central core of bone (Gurney & Jelliffe, 1973). Traditionally, in resource-poor settings, mid-upper-arm-muscle circumference (MUAMC) was used as a proxy for total body muscle mass and used to diagnose under­nutrition in com­munity surveys (Jelliffe, 1966).

Strong correlations between calculated values for MUAMC and fat-free mass estim­ates based on refer­ence in vivo methods such DXA (Carnevale et al., 2018) and com­puter tomography (Lambell et al., 2021) has led to the use of MUAMC as a proxy for muscle mass in the elderly (Akin et al., 2015; Landi et al., 2010). For example, in a pro­spec­tive study of older men (60‑79y), MUAMC was signif­icantly and inversely related to mort­ality, with the pre­dic­tion of mort­ality being greater when MUAMC was combined with waist cir­cum­fer­ence (Wannamethee et al., 2007). In addition, in persons 80y or older, MUAMC was posit­ively related to func­tional perfor­mance as well as survival. In this study, func­tional perfor­mance was assessed using the physical perfor­mance battery score based on three timed tests: 4‑m walking speed test, the balance test, and the chair stand test (Landi et al., 2010).

Low MUAMC has also been shown to be assoc­iated with longer hospital stays in hos­pital­ized adults. In a study by Pinto et al. (2021), such an assoc­iation was inde­pen­dently related with under­nutrition. MUAMC has also been used to detect low muscle mass in clinical and primary care settings where assess­ment of muscle mass using more direct in vivo methods such as com­puter tomography is not feasible (Gort-van Dijk et al., 2021).

Never­the­less, it is impor­tant to realize that the mid-upper-arm-muscle cir­cum­fer­ence is a one-dimen­sional measure­ment, whereas mid-upper-arm-muscle area is two-dimen­sional, and mid-upper-arm-muscle volume is three dimen­sional. Con­sequ­ently, if the volume of the mid-upper-arm muscle declines during under­nutrition or enlarges follow­ing a program of nutritional support, the mid-upper-arm-muscle cir­cum­fer­ence change will be pro­portion­ally smaller than the change in the mid-upper-arm muscle area (Heymsfield et al., 1982). Hence, MUAMC is insensitive to small changes of muscle mass that might occur, for example, during a brief illness.

Calculation of mid-upper-arm-muscle cir­cum­fer­ence

The equation for the calculation of mid-upper-arm-muscle cir­cum­fer­ence (MUAMC) is based on the same assump­tions as those described for mid-upper-arm fat area (Section 11.1.4).
Figure 11.16
Figure 11.16 Mid-upper-arm-muscle cir­cum­fer­ence.

If MUAC = mid-upper-arm cir­cum­fer­ence, TSK = triceps skin­fold, d1 = arm diameter,
and d2 = muscle diameter. Then:
TSK = 2 × sub­cut­aneous fat (d1 − d2) and MUAC = π × d1.
MUAMC = π × d2 = π × [d1 − (d1 − d2)]
= π × d1 − π × (d1 − d2). Hence
MUAMC = MUAC − (π × TSK)
Note that this equation requires all measure­ments to be in the same units (preferably mm).

As vari­ations in skin­fold com­press­ibility are ignored, and as the triceps skin­fold of females is generally more compres­sible than that of males, MUAMC in females may be under­estim­ated (Clegg & Kent, 1967). As a further complication, the MUAMC equation does not account for between subject variation in the diameter of the humerus relative to MUAC (Frisancho, 1981).

Interpretive criteria

There are no refer­ence ranges for MUAMC for children based on the WHO Multi­centre Child Growth Study or for the U.S. children used to compile the CDC 2000 BMI growth charts (Kuczmarski et al., 2000a). Some population-specific refer­ence data based on calculated MUAMC are avail­able for Argentinian children aged 4‑14y (Oyhenart et al., 2019a).

Kuczmarski et al. (2000b) compiled MUAMC refer­ence data for adults from the U.S. NHANES III survey (1988‑1994), but only for those adults > 50y. Mean (SE) and selected per­centile values of males and females for four age groups are avail­able. During this time, values for MUAMC increased up to age 65y in women and up to middle age in men and then steadily decreased. How­ever, secular-related changes in MUAC and triceps skin­fold thick­ness have been reported in U.S. males and females, so caution must be used when comparing more recent MUAMC data with these earlier MUAMC refer­ence data for U.S. adults (Frisancho, 1990).

11.2.3 Mid-upper-arm-muscle area

Mid-upper-arm-muscle area (AMA) is said to be prefer­able to mid-upper-arm-muscle cir­cum­fer­ence as an index of total body muscle mass because it more adequately reflects the true mag­ni­tude of muscle tissue changes (Frisancho, 1981). Several studies have examined the validity of mid-upper-arm-muscle area by com­par­ison with in vivo body composition refer­ence methods. Magnetic resonance imaging (MRI) and com­puter tomog­raphy (CT) are con­sidered the gold standard methods for in vivo assess­ment of muscle mass, although use of bio­elec­trical imped­ance (BIA) and DXA is increas­ing in clin­ical settings. Unfor­tun­ately, the validity of the cal­cu­lated mid-upper-arm-muscle area (AMA) as a proxy for actual arm-muscle mass is depen­dent on the charact­er­istics of the study population and the in vivo refer­ence method used. For example, the trad­itional equation appears to over­estim­ate AMA in obese patients and may not be appro­priate for under­nour­ished children (Heymsfield et al., 1982; Rolland-Cachera et al., 1997).

Despite these limitations, calculated AMA as a proxy for arm-muscle mass has been used by several investigators. Pinto et al. (2021) reported that AMA, like MUAMC, was linked with length of hospital stay. In Caucasian adult patients with AMA values lower than the 5th percen­tile (i.e., indic­ative of deplet­ion), the probab­ility of being dis­char­ged from the hos­pital was lower. How­ever, this finding has not been con­sis­tent in all studies (Luis et al., 2013). AMA has also served as an early indicator of de­terior­ating nutrit­ional status in a long­itud­inal study of pediatric patients with cystic fibrosis (Ellemunter et al., 2021).

AMA usually increases in adults up to age 65y in women and up to middle age in men, and then steadily decreases, as observed for MUAMC. Caution must be used, however, when inter­pret­ing estim­ates of AMA among adults who are obese or those with triceps skin­fold thick­ness that exceeds the 85th age-and sex-specific per­cent­iles. In such persons, esti­mates of AMA by anthro­pometry are said to over­estimate AMA deter­mined by com­puterized tomography, the degree of over­estim­ation varying directly with the degree of adi­posity (Forbes et al., 1988).

Calculation of mid-upper-arm-muscle area

The follow­ing equation may be used to estimate mid-upper-arm-muscle area (AMA): \[ \small \mbox{Arm muscle area} = \mbox{(MUAC − (π × TSK))}^{2}\mbox{/4π}\] where MUAC = mid-upper-arm cir­cum­fer­ence and TSK = triceps skin­fold thick­ness (Frisancho, 1981). Consistent units, preferably mm, should be used throughout. The index is based on the follow­ing assumptions: The cross-sectional areas of neuro­vas­cular tissue and the humerus are relat­ively small and ignored. The first three assump­tions are those used in the calcul­ations of mid-upper-arm-fat area and mid-upper-arm muscle cir­cum­fer­ence. Several investig­ators have reported the equation shown above over­esti­mates arm-muscle area com­pared with values based on in vivo refer­ence methods such as com­puter axial tomo­graphy (Heymsfield et al., 1982) or magnetic resonance imaging (Rolland-Cachera et al., 1997). As a result, revised equations have been developed. How­ever, their use has been limited, in part because the corrected formulae have only been vali­dated in selected popu­lation groups, and popu­lation-specific corrected equ­ations may be needed.

Interpretive criteria

Age and sex-specific smoothed percentiles for AMA based on the same population of healthy U.S. children aged 1‑20y used to construct the CDC 2000 BMI charts (Kuczmarski et al., 2000a) and the 2010 skin­fold thick­ness percentiles of Addo and Himes (2010) are shown in Figure 11.17 (Addo et al., 2017). The authors also provide the necessary LMS coefficients to calculate Z‑scores; see Addo et al. (2017) for more details.
Figure 11.17
Figure 11.17 Mid-upper-arm-muscle area-for-age percentiles for female US children and adolescents aged 1‑20y. Redrawn from Addo et al. (2017).

Note the percentile curves in Figure 11.17 represent the entire race-ethnicity groups that were repres­ented in the survey, so that inter­pretation based on these percen­tile curves should take into account any potential effects of specific race-eth­nicity.

Some local region-specific percen­tiles curves for AMA are avail­able, including those for boys and girls aged 4‑14y in Argentina (Oyhenart et al., 2019a). The mean AMA values for 3rd, 50th, and 97th percen­tiles are lower for the Agentinean children than their U.S. counter­parts (Oyhenart et al., 2019b).

Prediction equations adjusted for the age-depen­dent effects of height on AMA have also been developed by Addo et al. (2017). These pre­dic­tion equations may be especially helpful in pop­ula­tions with a high preval­ence of stunted children or those in which even well-nour­ished children are shorter than the average height.

Reference values for AMA for U.S. adults (18‑74y) or an older subset aged > 50y have not been compiled from the U.S. NHANES III data. Earlier data on AMA percentiles (5th through 95th) are avail­able based on the merged NHANES I and II data (Frisancho, 1990). These data are presented by age, sex, and race-ethnicity for persons 1‑74y; by height for boys and girls 2‑17y; and by age, sex, and frame size for adults aged 18‑74y. How­ever, secular changes in AMA in U.S. males and females have been reported, so caution must be used when inter­preting data based on these older refer­ence data.

11.2.4 Calf cir­cum­fer­ence

The quantity of skel­etal muscle (i.e., muscle mass) changes over the life course: increas­ing during growth in child­hood, stabil­izing in mid­life, after which muscle mass declines with ageing. In mid­life in adults about 30% of the skel­etal muscle is in the lower limbs, although after age 50y, the amount declines, with losses of ~1‑2% per year (Cruz-Jentoft et al., 2019).

Calf cir­cum­fer­ence is often used as a surrogate marker of skel­etal muscle mass. The measure­ment is simple and practical and was reported as the most used measure­ment in clinical practice to assess muscle mass, based on an inter­national survey in 55 countries (Bruyere et al.,2016). Calf cir­cum­fer­ence has the added advantage of having a lower fat mass com­pared to other body sites. As a result, the impact of fat mass on the measure­ments will be less (Bahat, 2021).

Calf cir­cum­fer­ence is used to diagnose sarco­penia in the elderly, a condition char­acter­ized by both low muscle mass and low muscle strength, which is assoc­iated with poor physical perfor­mance (Cruz-Jentoft et al., 2019). In older adults, sarco­penia is associ­ated with falls, frac­tures and mobil­ity dis­orders, cog­nitive impair­ments, and mortal­ity, as noted earlier (Cruz-Jentoft et al., 2010; 2019).

Several mechanisms may be involved in the onset and progression of sarco­penia, includ­ing protein syn­thesis, proteo­lysis, neuro­muscular integ­rity and muscle fat content; for further details, see Cruz-Jentoft et al. (2019). How­ever, other causes of sarco­penia besides ageing have been identified, including systemic disease, especially those invoking inflammation (e.g., cachexia), and malnutrition. For example, the Global Leadership Initiative on Malnutrition has included low muscle mass as an important criterion for the definition of malnutrition (Cederholm et al., 2019).

The use of calf cir­cum­fer­ence as a proxy for muscle mass to identify older adults with or at risk for sarco­penia is supported by both the Asian Working Group for Sarco­penia (AWGS) (Chen et al., 2020), and the European Working Group on Sarcopenia in Older People (EWGSOP) (Cruz-Jentoft et al., 2019), especially in settings where no other muscle mass diag­nostic methods are avail­able. Several invest­igators have com­pared the perfor­mance of calf cir­cum­fer­ence as an indirect anthro­pometric marker of appen­dicular skel­etal muscle mass against in vivo refer­ence methods. Most of these studies have been on the elderly and have reported moderate to good correlations of calf cir­cum­fer­ence against direct measure­ments of skel­etal muscle mass using refer­ence methods such as dual-energy X-ray absorp­tiometry (DXA) (Kawakami et al., 2015) and bio­elec­trical imped­ance (Gonzalez-Correa et al., 2020).

More recently, the use of calf cir­cum­fer­ence as an adequate pre­dictor of skel­etal muscle mass over the entire adult life­span has been inves­tigated (Santos et al., 2019). In this U.S. study of adults from the 1999‑2006 NHANES survey, calf cir­cum­fer­ence was verified as a satis­factory predictor of appen­dicular skel­etal muscle mass based on DXA (Santos et al., 2019). The impact of age, sex, and eth­nicity was also examined, given the earlier reports of their impact on skel­etal muscle measure­ments (Rush et al., 2009; He et al., 2003). The U.S. adult age groups studied were: 18‑20y; 20‑39y;40‑59y; >60y and their ethnicities were: Mexican American; African America, White, Other. A pre­dic­tion equation was developed based on calf cir­cum­fer­ence and age, sex, and ethnicity or self-reported race.

In a later study employing the same NHANES 1999‑2006 dataset, calf cir­cum­fer­ence cutoff values for U.S. adults according to sex, ethnicity and race were defined as a marker to identify low muscle mass, vali­dated by DXA measure­ments (Gonzalez et al., 2021). With these cutoff values, sarco­penia could be diagnosed, not only in older par­tic­ipants, but across the full adult life­span. Factors con­found­ing the calf cir­cum­fer­ence measure­ments across the entire adult life­span were also ident­ified. In addition to sex and ethnic or self-reported race ident­ified earlier as con­found­ers, BMI was also shown to be a very impor­tant con­founder in this later study. Calf cir­cum­fer­ence values were reported to be lower for those with BMI < 18.5(kg/m2), but higher for those over­weight or obese com­pared to those with a normal BMI, irre­spec­tive of age, ethnicity, or race. Further, the confounding effect of adiposity could be removed by applying BMI adjust­ment factors for calf cir­cum­fer­ence for those partic­ipants outside the normal-weight BMI range (i.e., BMI 18‑24.9) (see Table 11.11). Hence, by apply­ing these BMI adjust­ment factors, the con­found­ing effects of adi­posity can be removed so that low calf cir­cum­fer­ence under any BMI can be identified.

Measurement of calf cir­cum­fer­ence

Figure 11.18
Figure 11.18 Measuring tape position for maximal calf cir­cum­fer­ence. From CDC Manual (Revised Dec. 2000)
The measure­ments are taken using a steel mea­sur­ing tape while the subject is in a seated position. The tape is placed around the calf and moved up and down to locate the maximum cir­cum­fer­ence as shown in Figure 11.18. The tape must be held snugly but not tight and the measure­ment taken to the nearest 0.1cm. In the U.S. NHANES, measure­ments are performed on the right calf (CDC Manual, Revised Dec. 2000).

Interpretive criteria

Cutoff points for calf cir­cum­fer­ence rep­resent­ing low muscle mass were first devel­oped from studies in older persons. The cut­offs recom­mended by the Asian Working Group for Sarco­penia (AWGS) are < 34cm for males and < 33cm for females (Chen et al., 2020).

Calf cir­cum­fer­ence cutoff values for U.S. adults ≥ 18y with a normal BMI (18.5‑24.9kg/m2) and defined by Gonzalez-Arellanes et al. (2021) are presented in Table 11.10. The cut­off values were deter­mined by using 1 or 2 SDs below the mean (from a refer­ence young popul­ation aged 18‑39y and of normal weight) for moder­ately low or severely low calf cir­cum­fer­ence values, respect­ively. The values based on 1 SD below the mean and indic­ative of a moder­ately low calf cir­cum­fer­ence are appro­priate to detect low muscle mass in adults > 65y for sarco­penia diag­nosis / screening (Table 11.10).

Table 11.10 Reference and cutoff values for calf cir­cum­fer­ence according to sex, ethnicity, and race, from participants with normal BMI3
1 Reference values defined as mean values from participants aged 18‑39y.
2 values defined as −1 SD below the mean values.
3 BMI: 18.5‑24.9 kg/m2; for other BMI groups, use the adjusting factors for correction of calf cir­cum­fer­ence (Table 11.11). Data from González-Arellanes et al. (2021).
MalesFemales
n Reference1
mean ± SD
Cutoff2
−1 SD
n Reference1
mean ± SD
Cutoff2
−1 SD
Total - All subjects 1639 36.3 ± 2.2 34.1 1465 35.3 ± 2.3 33.0
White Non-Hispanic633 36.6 ± 2.2 34.4 656 35.6 ± 2.2 33.4
Black Non-Hispanic429 36.4 ± 2.2 34.2 279 35.3 ± 2.2 33.1
Mexican American 428 34.9 ± 2.1 32.8 378 33.9 ± 2.3 31.6
Other races
& ethnicities
149 36.0 ± 2.1 33.9 152 34.6 ± 2.2 32.4

Table 11.11 presents an example of the BMI adjust­ment factors (in cm), noted earlier, for calf cir­cum­fer­ence for males with BMIs (kg/m2) outside the normal range based on the entire life­span (i.e., total sample) and by ethnicity and race. Corres­pond­ing adjust­ment factors for females are avail­able in González-Arellanes et al. (2021). To apply the adjust­ment factors, add 4cm to the calf circumference measure for BMI < 18.5) or subtract 3, 7, or 12cm from the calf circumference measure for BMI 25‑29, BMI 30‑39, and BMI ≥ 40, respectively. These adjust­ment factors are derived from linear regres­sion for calf cir­cum­fer­ence, adjusted by age, for BMI outside the 18.5‑24.9 (kg/m2).

Applic­ation of these BMI adjust­ment factors to the meas­ured calf cir­cum­fer­ence and then comparison with the cut­off values given in Table 11.10 ensures the correct ident­if­ication of low calf cir­cum­fer­ence under any BMI (Table 11.11).

Table 11.11 Adjustment factors for calf cir­cum­fer­ence by BMI for males outside the 18.5‑24.9 BMI range, calculated from linear regression of calf cir­cum­fer­ence, adjusted by age. Data from González-Arellanes et al. (2021), who also present comparable data for females.
BMI Group
(kg/m2)
Total
All subjects
White Non-
Hispanic
Black Non-
Hispanic
Mexican-
American
Other races
& ethnicities
< 18.5 +4.3 +4.7 +4.2 +4.0+3.4
25‑29.9 −3.4 −3.4 −3.4 −3.1−3.5
30‑39.9 −6.8 −6.7 −7.2 −6.4−6.9
≥ 40 −12.0 −11.9 −12.0 −12.1 −12.2
Without these adjustments, raw calf circumference measurements would result in an underestimate of the prevalence of low calf circumference in those with BMI ≥ 25 and an over­estimate in those with a BMI < 18.5.

By applying these BMI adjust­ment factors, a stronger correlation of calf circumference with function may be obtained, so that in the future, BMI-adjusted calf circum­ference measure­ments should be vali­dated for predicting sarcopenia-related health outcomes such as functional impair­ment, falls, and mortal­ity. In addition, use of these BMI adjust­ment factors and cut-offs should be employed in studies of adults in other countries (Bahat, 2021).

11.2.5 Hand grip strength

Research suggests that a measure of muscle mass such as calf cir­cum­fer­ence should be com­ple­mented with measures of muscle strength (Lauretani et al., 2003). Studies using magnetic resonance imaging have shown that muscle strength decreases by more than 50% in in the elderly (70‑82y) com­pared to that in young men (18‑30y). More­over, only half the decrease in muscle strength that occurs with aging is accounted for by a decrease in the volume of muscle (Morse et al., 2005).

Hand grip strength is the recommended tech­nique for mea­sur­ing muscle strength by the European Working Party on Sarcopenia in Older People (EWGSOP) (Cruz-Jentoft et al., 2019) and the Asian Work­ing Group for Sarco­penia (AWGS) (Chen et al., 2020). It is the simplest and most inex­pen­sive method to assess muscle strength and has been intro­duced by AWGS to identify “possible sarco­penia” with or with­out reduced phys­ical perform­ance in both com­munity health care and preven­tion settings (Chen et al., 2020). How­ever, more studies are needed to estab­lish whether region-specific cutoffs for the diag­nosis of sarco­penia based on hand grip strength are neces­sary. Hand grip strength is also used as a measure of physical fitness in children (Tremblay et al., 2010; Wick et al., 2021) and athletes (Leyk et al., 2007; Pizzigalli et al., 2017).

Over the life course, hand grip strength increases, peaking in early adult life at a strength that is main­tained through to mid­life, after which it declines, with the loss accel­er­ating through old age (Roberts et al., 2011). For example,
Figure 11.19
Figure 11.19. Muscle strength and the life course. Redrawn from Cruz-Jentoft et al. (2019).
in a large study of U.K. persons aged 4‑90y, the prev­alence of weak grip strength increased sharply with age, with a peak prevalence by age 80y of 23% in males and 27% in females (Dodds et al., 2014). In all age groups, hand grip strength is higher in males than females. Ethnic and regional vari­ations in muscle strength may also occur, promp­ting studies to develop cutoffs for weak muscle strength in several geo­graphic regions (Lera et al., 2018; Steiber, 2016; Auyeung et al., 2020).

Handgrip strength is said to be a better predictor of func­tional health out­comes than low muscle mass. Several func­tional health out­comes have been used to define optimum hand grip strength in the elderly. They include slow meas­ured walking speed, self-reported dif­ficulty in walking (Lauretani et al., 2003; Sallinen et al., 2011), limit­ations in Instru­mental Activ­ities of Daily Living, and altered physical per­form­ance. The latter may be evaluated through the Timed Up and Go test, 5-time chair stand test (> 12s), 6-meter walk (< 1.0m/s) or short physical perform­ance battery (< 9) (Lera et al., 2018; Chen et al., 2020). Most of these relation­ships have been based on cross-secti­onal data. How­ever, there have also been several pro­spective cohort studies. In some, lower hand­grip strength at discharge from acute care hospitals has been assoc­iated with 30‑day readmis­sion (Allard et al., 2016), whereas in others, assoc­iations of hand-grip strength with all-cause mortal­ity and cardio­vascular mortal­ity have been reported (Lera et al., 2018; Leong et al., 2015; Wu et al., 2017; Rantanen et al., 2003; Steiber, 2016).

Studies have also focused on the effects of modi­fiable behav­iors such as exer­cise train­ing on hand grip strength to prevent or slow adverse changes in muscle strength (Labott et al., 2019). Bohaanon (2017) has cau­tioned that relat­ively large percen­tage changes in grip strength may be necessary to conclude with confid­ence that a real change has occurred in muscle strength over time in response to treat­ment or an inter­vention. The EWSOP2 group 1 have emphasized that more studies are needed to estab­lish whether the current recom­mended cut­offs improve the pre­dic­tion of out­comes most sen­sit­ive to res­ponse to treat­ment for sarco­penia (Cruz-Jentoft et al., 2019).

Measurement of hand grip strength

Accurate measure­ment of hand grip strength requires use of a calib­rated hand­held dynamo­meter. The hydraulic hand dynamo­meter Jamar measures grip force (kgf) and is accep­ted as the gold standard instru­ment. The Jamar dynamo­meter is small and portable, although relatively heavy (i.e.,1.5 lb), with a dial that reads force in both kilograms and pounds, and allows assess­ment to the nearest 1kg or 2.5 lb. In Asia, the spring-type dynamo­meter (Smedley) that detects the amount of spring tension (kgf) is more widely used. Data generated by these two devices are not comparable (Kim & Shinkai, 2017). Never­the­less, the AWGS 2019 recommend using either device, provided standard measure­ment protocols for the device are followed (Chen et al., 2020).

Measurement of grip strength obtained by dynamo­metry appears to have good to excellent relative test-retest relia­bility, even among older adults (Bohannon, 2017). Dynamo­meters should be calibrated every 4‑6mos to maintain long­itud­inal validity. The methods used to measure grip strength vary. Consequently, Roberts et al. (2011) have developed a stan­dard­ized method to increase the pre­cision of measure­ments within any given study, and to facil­itate com­parison of results across studies. Never­the­less, other factors unrelated to muscle, such as motiv­ation or cogni­tion, may hamper the correct assess­ment of muscle strength. Details of this stan­dard­ized method are outlined in Box 11.1.
Box 11.1 Standardized method for grip strength via Southampton protocol based on the JAMA dynamometer (Figure 11.20).
  1. Sit the participant comfortably in a standard chair with legs, back support and fixed arms. Use the same chair for every measure­ment.
  2. Ask them to rest their forearms on the arms of the chair with their wrist just over the end of the arm of the chair—wrist in a neutral position, thumb facing upwards.
  3. Demonstrate how to use the Jamar handgrip dynamometer to show that gripping very tightly registers the best score.
  4. Start with the right hand.
  5. Position the hand so that the thumb is round one side of the handle and the four fingers are around the other side. The instrument should feel comfortable in the hand. Alter the position of the handle if necessary.
  6. The observer should rest the base of the dynamometer on the palm of their hand as the subject holds the dynamometer. The aim of this is to support the weight of the dynamometer (to negate the effect of gravity on peak strength), but care should be taken not to restrict its movement.
  7. Encourage the participant to squeeze as long and as tightly as possible or until the needle stops rising. Once the needle stops rising the participant can be instructed to stop squeezing.
  8. Read grip strength in kilograms from the outside dial and record the result to the nearest 1kg on the data entry form.
  9. Repeat measure­ment in the left hand.
  10. Do two further measure­ments for each hand alternating sides to give three readings in total for each side.
  11. The best of the six grip strength measure­ments is used in statistical analyses so as to encourage the subjects to get as high a score as possible.
  12. Also record hand dominance, i.e. right, left or ambidextrous (people who can genuinely write with both hands) and the equipment model used.
From Roberts et al. (2011).

Figure 11.20
Figure 11.20 The Jamar hydraulic hand dynamo­meter.
Note that in the U.S. NHANES studies the Smedley dynamo­meter has been used. The U.S. protocol recommends standing unless partic­ipants are unable to stand unassisted, with full elbow extension rather than sitting with 90° elbow flexion as described in Box 11.1 The AWGS (2019) also recommend standing, where possible, with full elbow extension for the Smedley dynamo­meter but sitting with 90° elbow flexion when the the Jamar dynamo­meter is used (Chen et al., 2020).

Interpretive criteria

As noted earlier, although the measure­ments generated from dynamo­meters differ depen­ding on the device used, currently dynamo­meter-specific cutoff values are not recommended because of insuf­ficient comparative data (Chen et al., 2020). Differences also exist in both the methods and fun­ctional out­comes used to define cutoff values for dynamo­metry.

For Asian elderly, the AWGS group recommends diagnostic hand grip cut­offs for weak muscle strength indicative of “possible sarco­penia” as < 28kg for men and < 18kg for women (Chen et al., 2020). These cutoff values are based on the lowest quintile for muscle strength based on seven community-based cohorts in East and South­east Asia aged > 60y (Auyeung et al., 2020).

For European elderly, the EWSOP2 group have defined hand grip cut­offs for weak muscle strength indic­ative of sarco­penia as < 27kg for men and < 16kg for women (Cruz-Jentoft et al., 2019). These are lower than the AWGS cutoffs, and are based on the U.K. data in which weak grip strength is based on strength at least 2.5 SDs below the gender-specific mean from a healthy and young U.K. refer­ence pop­ulation (Dodds et al., 2014).

For Chilean community dwelling adults > 60y, the cutoffs proposed for weak muscle strength were < 27kg for men and < 15kg for women. These were based on the 25th percentile values (by sex) for hand grip strength for these elderly persons. Lera et al. (2018) also per­formed sur­vival analysis on follow-up data of 9.2y in a sub­group of these elderly partic­ipants; hand grip values below 25th percentile were associ­ated with an increased risk of all-cause mortal­ity.

For Germans aged 17‑90y, cutoff risks were < 33kg for men and < 21kg for women, defined as 2 SD below the sex-specific peak mean value for grip strength across the life course (Steiber, 2016). Thres­holds for a critic­ally weak grip strength assoc­iated with elevated mort­ality risk were defined as 1SD or more below the stan­dard­ized mean hand grip strength. These cutoffs were defined using survival analysis from an 8y follow up on a restric­ted sample of older individ­uals aged 55‑90y.

Several sets of region-specific normative refer­ence values for hand grip strength are avail­able. Examples across the life course from the U.K, U.S. Germany, and the U.S. are discussed briefly below. In the United Kingdom for example, percentiles (10th, 25th, 50th, 75th, 90th) by sex for grip strength based on cross-sectional obser­vations in persons aged 4‑90y from 12 U.K. studies have been compiled (Dodds et al., 2014). A subset of these results are presented in Table 11.12.
Table 11.12 Normative values for grip strength for UK Males. Data from Dodds et al. (2014).
Centiles (kg)
Age(y) n 10th 50th 90th Mean (SD)
10322212172217.2 (4.1)
2035430405241.5 (7.3)
3098438516451.6 (9.6)
4088038506350.3 (10.3)
5082035486047.6 (10.1)
60268333455644.6 (9.2)
70328629394939.1 (8.1)
80111523324232.2 (7.3)
9043116253324.7 (6.8)
In the United States, data for height (mean, SD), weight (mean, SD), mean (SD) handgrip strength (kg) and the 5th, 10th, 50th, 25th and 50th percentiles by side of hand (dominant and non-dominant), sex, and age (3‑17y) are presented (Bohannon et al., 2017). The cross-sectional data were from the US National Institutes of Health Toolbox project conducted in 2011. The stan­dard­ized method for mea­sur­ing hand grip strength recommended by Roberts et al. (2011) using a Jamar dynamometer, was used in this U.S. study.

Later, Wang et al. (2018) used the same U.S. dataset to compile refer­ence values for US adults 18‑85y. Again, data for height, weight, hand grip strength (kg) and percen­tiles (10th, 25th, 50th, 75th and 90th) by sex, side of hand (dominant and non-dominant) and 13 age groups (limited to 5-year spans, except the strata 18‑24y) are presented. No cutoffs for hand grip strength based on the data for children or adults were derived.

Table 11.13 Normative refer­ence values for handgrip strength for German women 40‑44y. Abstracted from more comprehensive data for men and women aged 17‑90y. Steiber (2016)
1 Mean −1 age-group-specific SD
Height (cm)Mean HGS (kg)Threshhold1 (kg)
150‑15431.525.3
155‑15932.726.4
160‑16433.727.4
165‑16934.828.6
170‑17435.829.6
175‑17937.130.8
180‑18438.031.8
In Germany, the normative refer­ence values are based on a nationally representative sample of healthy partic­ipants aged 17‑90y. Mean values for hand­grip strength across seven height groups (within each age group: 17‑19y, 20‑24y, 25‑29y, 30‑34y, 35‑39y, 40‑44y, 45‑49y) were calcu­lated and pre­sented as sex-specific refer­ence values, strat­ified by age and body height. For example, the refer­ence value for 40‑44y women with a height of 165‑169cm is 34.8kg; this value increases by about 1kg for every 5cm of additional height, as shown in Table 11.13 (Steiber, 2016).

In some regions, refer­ence values of handgrip strength have been restricted to certain age groups. For example, in community-based Asian cohorts (Auyeung et al., 2020), only population data for those age > 60y were included, with the lowest quin­tile (kg) and mean (SD) kg by sex and age group presented, as shown in Table 11.14.

Table 11.14 Sex- and age-specific lowest quintile and means of handgrip strength (kg) in subjects age > 60y from community-based Asian cohorts. Data abstracted from Auyeung et al. (2020)
Age (y)n Lowest
quintile (kg)
Mean (SD) (kg)
Men
60‑69.9 5319 32.7 37.9 (6.5)
70‑79.9 5317 28.0 33.3 (6.3)
≥ 801554 23.6 28.4 (6.2)
Women
60‑69.9 6384 20.0 23.6 (4.6)
70‑79.9 6009 17.8 21.1 (4.5)
≥ 801761 14.7 18.3 (4.5)
In Chile, percentiles by sex and age group are also restricted to community-dwelling persons > 60y (Lera et al., 2018), whereas in Canada data from the 2007‑2009 Canadian Health Measures Survey included only children, with the mean and median values aged 7‑10y; 11‑14y; 15‑19y (Tremblay et al., 2010).

Note that because all these normative refer­ence values are based on cross-sect­ional data, they are likely to under­estimate indi­vidual decline and hence should not be used to monitor the tra­ject­ories of indiv­iduals. Moreover, as with all cross-sectional studies, such a design limits the degree to which causal and age-related inference can be drawn (Perna et al., 2015).

Acknowledgements

RSG would like to thank past collaborators, particularly my former graduate students, and is grateful to Michael Jory for the HTML design and his tireless work in directing the translation to this HTML version.